
ProjectPulse MCP 🏥
GitHub repository health monitoring for AI assistants — works with any language, any repo.




This Model Context Protocol (MCP) server gives AI assistants the ability to analyze health, security, CI/CD status, and delivery metrics of any GitHub repository — directly from your conversations.
✨ Features
- 🏥 Health Score — comprehensive 0-100 score with grade (A-F), category breakdown, and improvement suggestions
- 🔒 Security — Dependabot alerts blended with OpenSSF Scorecard checks (60/40 weighted)
- 📊 DORA Metrics — proxy DORA metrics from GitHub data: deployment frequency, lead time, change failure rate, MTTR
- 🔍 Code Scanning — CodeQL and other code scanning alerts with severity, message, and creation date
- 📦 Dependency Analysis — Dependabot alerts with severity filtering
- ⚙️ CI/CD Status — recent GitHub Actions workflow runs and conclusions
- 📋 Repository Info — stars, forks, language, license, and general metadata
📸 Example
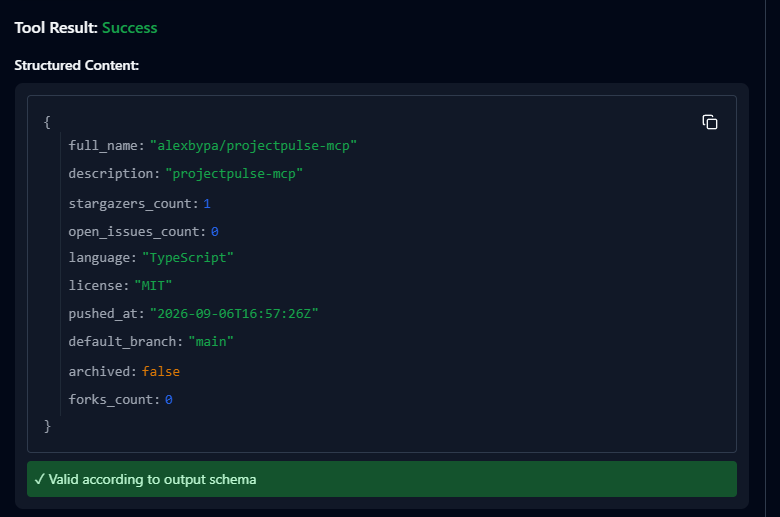
MCP Inspector — get_repo_health
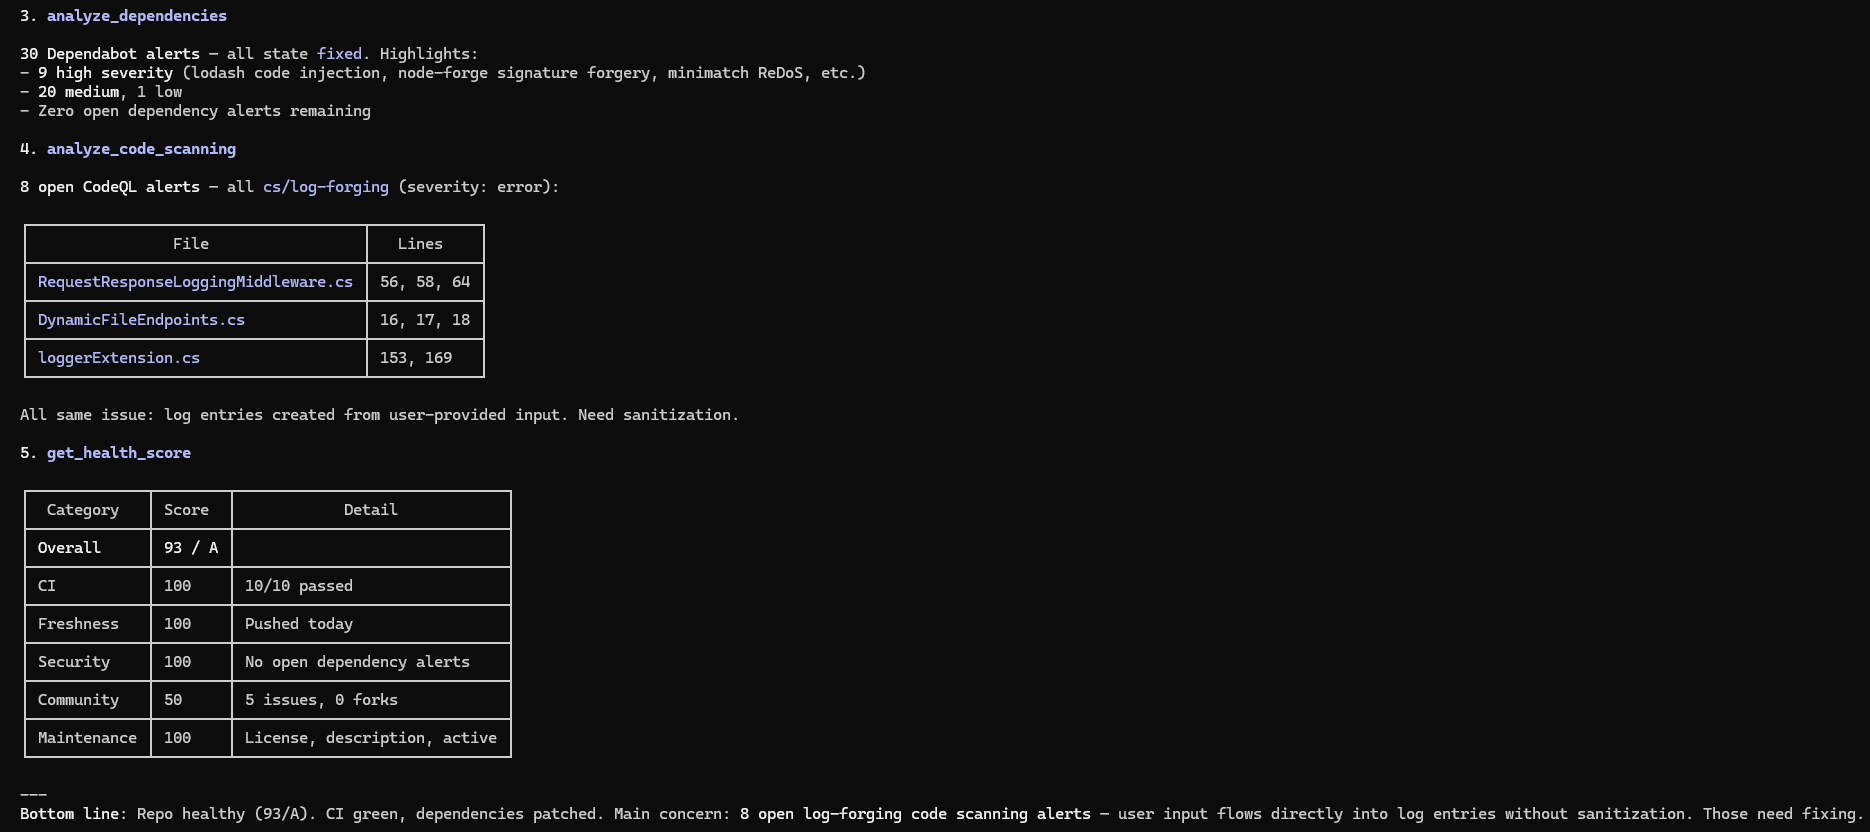
Code Scanning — analyze_code_scanning
🚀 Quick Start
Claude Code (CLI)
claude mcp add projectpulse -- npx projectpulse-mcp
Note: You need a
.envfile with yourGITHUB_TOKENin the directory where you run Claude Code.
Claude Desktop
Step 1: Get a GitHub Token
- Go to GitHub Settings > Developer settings > Personal access tokens > Fine-grained tokens
- Give it a name (e.g.,
projectpulse) - Select the repositories you want to monitor (or "All repositories")
- Under Permissions, grant Read-only access to:
Code scanning alertsDependabot alertsMetadata(enabled by default)
- Click Generate token and copy it
Step 2: Configure Claude Desktop
- Open Claude Desktop
- Go to Settings (gear icon) > Developer > Edit Config
- This opens
claude_desktop_config.json. Add theprojectpulseentry inside"mcpServers":
{
  "mcpServers": {
    "projectpulse": {
      "command": "npx",
      "args": ["-y", "projectpulse-mcp"],
      "env": {
        "GITHUB_TOKEN": "ghp_paste_your_token_here"
      }
    }
  }
}
- Save the file and restart Claude Desktop
Step 3: Verify it works
In a new Claude Desktop conversation, try asking:
"Check the health score of facebook/react"
Claude should call the get_health_score tool and return an A-F grade with a detailed breakdown.
Troubleshooting
| Problem | Solution |
|---|---|
| Tools not showing up | Restart Claude Desktop after editing the config file |
| "Rate limit exceeded" errors | Make sure GITHUB_TOKEN is set correctly in the config |
| Dependabot/CodeQL data missing | Your token needs Code scanning alerts and Dependabot alerts permissions |
npx not found | Install Node.js (v18 or later) and make sure npx is in your PATH |
Other MCP Clients (Cursor, Windsurf, etc.)
Configure a new MCP server with:
- Transport:
stdio - Command:
npx - Arguments:
-y projectpulse-mcp - Environment:
GITHUB_TOKEN= your GitHub PAT
🛠️ Tools
get_health_score
Calculates a 0-100 health score with an A-F grade. Evaluates 5 weighted categories: CI reliability (25%), code freshness (20%), security posture (25%), community activity (15%), and maintenance quality (15%). Returns actionable improvement suggestions for low-scoring categories. On repeated calls for the same repo, includes a trend comparison showing score change since last check. Queries multiple GitHub API endpoints and OpenSSF Scorecard.
Side effect: saves a trend snapshot to local disk (~/.projectpulse/snapshots/).
Inputs: owner, repo
Try asking: "What's the health score of microsoft/vscode?"
get_dora_metrics
Calculates proxy DORA metrics from public GitHub data: Deployment Frequency (from releases), Lead Time for Changes (PR created → merged), Change Failure Rate (CI failure percentage), and Mean Time to Recovery (CI failure → next success). Returns null for metrics with insufficient data. Queries multiple GitHub API endpoints (releases, pulls, actions) — heavier API usage than single-endpoint tools.
Inputs: owner, repo, days (optional, 7-90, default 30)
Try asking: "Show me the DORA metrics for vercel/next.js over the last 60 days"
compare_repos
Compares health scores side-by-side for 2-5 repositories. Returns each repo's full health breakdown ranked by score. Useful for evaluating alternatives or benchmarking your project against similar ones. API calls are multiplied by the number of repos compared.
Inputs: repos (array of {owner, repo})
Try asking: "Compare the health of expressjs/express, fastify/fastify, and koajs/koa"
get_repo_health
Fetches basic repository metadata: stars, forks, open issues count, primary language, license, last push date, default branch, and archive status. Use this for a quick overview — for a computed grade, use get_health_score instead.
Inputs: owner, repo
Try asking: "Give me general info about torvalds/linux"
analyze_dependencies
Lists Dependabot security alerts for vulnerable package dependencies (npm, pip, Maven, etc.) grouped by severity (critical, high, medium, low). Optionally filter by a specific severity level. Requires a token with Dependabot alerts permission.
Inputs: owner, repo, severity (optional)
Try asking: "Show me critical dependency vulnerabilities in my-org/my-app"
check_ci_status
Returns the most recent CI/CD workflow runs from GitHub Actions: status (success, failure, in_progress), conclusion, branch, duration, and timestamps. Useful for checking if builds are green before deploying or merging.
Inputs: owner, repo, limit (optional, default 10)
Try asking: "Are the CI builds passing for facebook/react?"
analyze_code_scanning
Lists CodeQL and other code scanning alerts: rule ID, severity, vulnerability message, affected file and line number, and creation date. Requires a token with Code scanning alerts permission. Can optionally trigger a CodeQL scan and wait for results (requires Advanced Setup, not Default Setup).
Inputs: owner, repo, trigger_scan (optional, default false), poll_timeout_seconds (optional, default 300), poll_interval_seconds (optional, default 15)
Try asking: "Are there any code scanning vulnerabilities in my-org/my-api?"
ping
Simple connectivity check. Returns "pong" with your message. Use to verify the MCP server is running.
Inputs: message
🆕 What's New
OpenSSF Scorecard Integration
Security score now blends Dependabot alerts (60%) with OpenSSF Scorecard checks (40%) for a more complete picture. 12 security-relevant checks are evaluated — repos without a scorecard gracefully fall back to Dependabot-only scoring.
DORA Metrics
New get_dora_metrics tool calculates proxy DORA metrics from public GitHub data:
| Metric | Source | Unit |
|---|---|---|
| Deployment Frequency | Releases | releases/week |
| Lead Time for Changes | PR created → merged | hours (median) |
| Change Failure Rate | CI workflow conclusions | percentage |
| Mean Time to Recovery | CI failure → next success | hours (median) |
Metrics return null when insufficient data is available — works safely on any repository.
⚙️ Configuration
GITHUB_TOKEN
Required to avoid rate limits and access security data (Dependabot, CodeQL alerts).
Option A: Fine-grained PAT (Recommended)
- Settings > Developer settings > Personal access tokens > Fine-grained tokens
- Select target repositories
- Grant Read-only access to:
Code scanning alertsDependabot alertsMetadata(default)
Option B: Classic Token
Generate with repo + security_events scopes.
Providing the token:
- Claude Desktop: set in
claude_desktop_config.json(see Quick Start) - Claude Code / Local: create a
.envfile:GITHUB_TOKEN=ghp_your_token_here
👤 Author
🤝 Contributing
Contributions, issues and feature requests are welcome! Feel free to check the issues page.
⭐ Show your support
Give a star if this project helped you!
📝 License
MIT — see the LICENSE file for details.