prom-mcp
Prometheus MCP server for AI agents: PromQL queries, alert explanations, series discovery.
Runs on your machine from its package; the steps are below.

What it does
- Reads
- Writes
- High impact
At most: only reads or looks up information.
What it costs
FreeOdel charges nothing per call. The publisher may charge for its own service.
Runs locally over stdio
This server isn't hosted — your MCP client launches it from a package registry. Use one of the commands below, or drop the config into your client (e.g. Claude Desktop).
Distributed as an MCP bundle (`https://github.com/aniketatgithub/prom-mcp/releases/download/v0.2.0/prom-mcp_v0.2.0_linux_amd64.mcpb`) — download it and import the bundle in your MCP client.
Distributed as an MCP bundle (`https://github.com/aniketatgithub/prom-mcp/releases/download/v0.2.0/prom-mcp_v0.2.0_linux_arm64.mcpb`) — download it and import the bundle in your MCP client.
Distributed as an MCP bundle (`https://github.com/aniketatgithub/prom-mcp/releases/download/v0.2.0/prom-mcp_v0.2.0_darwin_amd64.mcpb`) — download it and import the bundle in your MCP client.
Distributed as an MCP bundle (`https://github.com/aniketatgithub/prom-mcp/releases/download/v0.2.0/prom-mcp_v0.2.0_darwin_arm64.mcpb`) — download it and import the bundle in your MCP client.
prom-mcp — Prometheus MCP Server for AI Agents (Claude Code, Cursor)


prom-mcp is a Prometheus MCP server (Model Context Protocol) that gives AI agents production-grade eyes on your metrics. Connect Claude Code, Cursor, or any MCP client to Prometheus and let the agent run PromQL queries, explain firing alerts with their rule definitions, and discover which series actually exist before querying — so it investigates instead of guessing.
Built by a production engineer who works on-call, so the output reads like a triage note, not a raw JSON dump.
5 tools • 2 resources • 1 triage prompt • single Go binary • zero dependencies • stdio
Install
Claude Desktop (MCPB, no toolchain needed)
Download the bundle for your platform, then open it or drag it into Claude Desktop (Settings → Extensions). You will be asked for your Prometheus URL, which defaults to http://localhost:9090.
| Platform | MCPB bundle |
|---|---|
| macOS (Apple silicon) | prom-mcp_v0.2.0_darwin_arm64.mcpb |
| macOS (Intel) | prom-mcp_v0.2.0_darwin_amd64.mcpb |
| Linux (x86_64) | prom-mcp_v0.2.0_linux_amd64.mcpb |
| Linux (arm64) | prom-mcp_v0.2.0_linux_arm64.mcpb |
Claude Code
With the binary on your PATH (release download or go install, see below):
claude mcp add prom -- prom-mcp
Set PROM_URL in your shell first if your Prometheus is not at http://localhost:9090, or pass --env PROM_URL=... to the command. More variants in examples/claude-code.md.
Cursor
Add to ~/.cursor/mcp.json (same file as examples/cursor-mcp.json):
{
  "mcpServers": {
    "prom": {
      "command": "prom-mcp",
      "env": {
        "PROM_URL": "http://localhost:9090"
      }
    }
  }
}
VS Code
Add to .vscode/mcp.json (same file as examples/vscode-mcp.json):
{
  "servers": {
    "prom": {
      "command": "prom-mcp",
      "env": {
        "PROM_URL": "http://localhost:9090"
      }
    }
  }
}
Go install / build from source
go install github.com/aniketatgithub/prom-mcp@latest
git clone https://github.com/aniketatgithub/prom-mcp && cd prom-mcp
go build -o prom-mcp ./cmd/prom-mcp
Plain binaries for all four platforms are also on the v0.2.0 release, next to the MCPB bundles above.
What to ask
| You ask | prom-mcp does |
|---|---|
| "Why is NodeDown firing?" | prom_alerts_explain returns the active alert joined with its rule expression, group, for, labels, and annotations. |
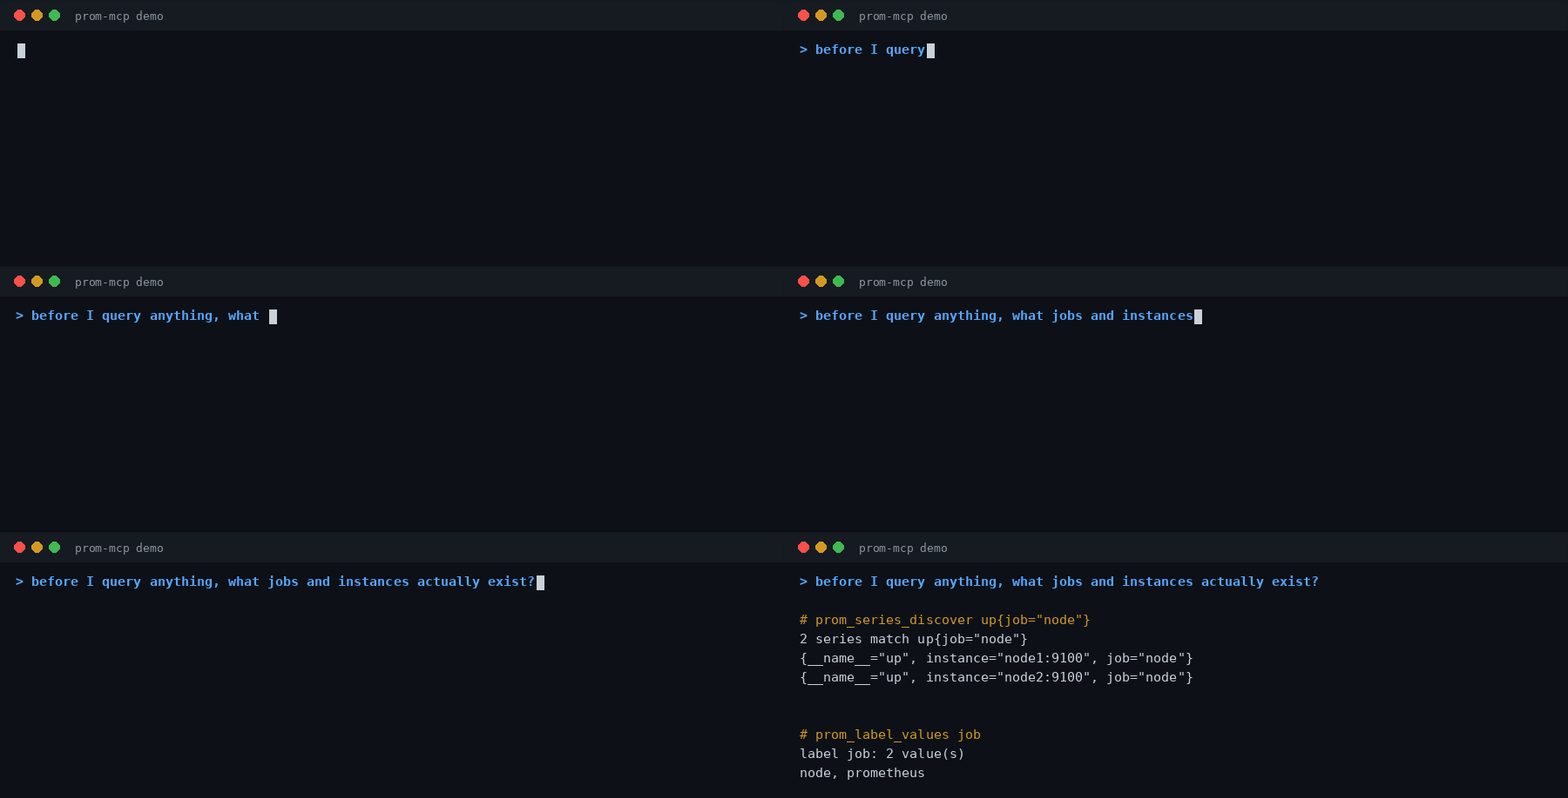
| "What jobs and instances actually exist?" | prom_series_discover and prom_label_values list real series and label values before any query is written. |
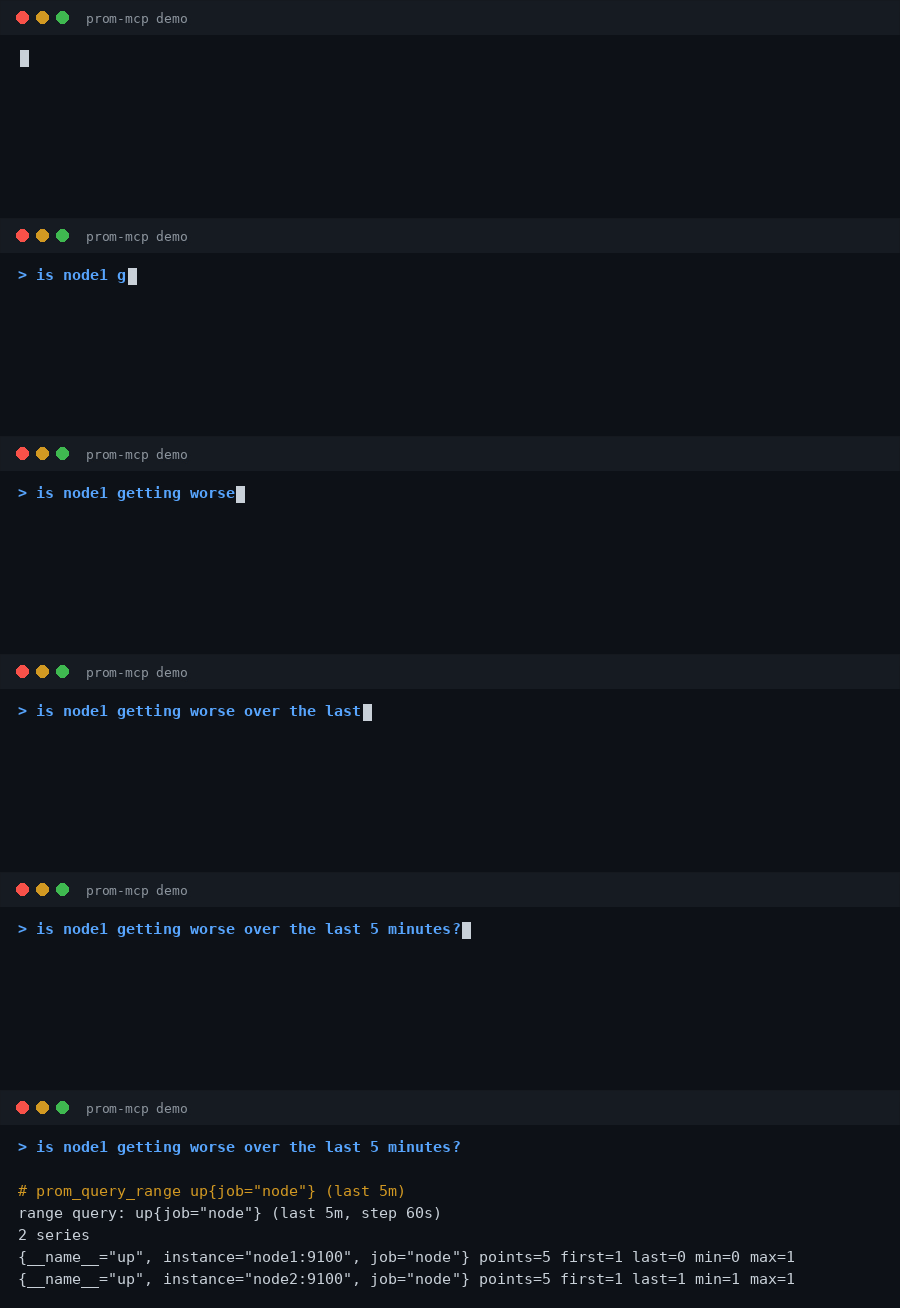
| "Is this getting worse?" | prom_query_range summarizes the window per series: points, first, last, min, max. |
See it in action
Alert triage: why is the node down?
Discover what exists before querying:
Check the trend: is node1 getting worse?
What it looks like
Ask your agent "why is the node down?" and the alert tool answers in triage shape:
1 active alert(s)

[firing] NodeDown (since 2026-10-08T10:00:00Z, value 0)
  labels: {alertname="NodeDown", instance="node1:9100", job="node", severity="critical"}
  summary: Node node1:9100 is down
  description: Scrapes failing for 5m
  rule: up{job="node"} == 0
  group: node.rules
  for: 5m0s
Plus a built-in triage prompt template that walks the agent through alerts, discovery, and trend checks in order.
Tools
| Tool | What it does |
|---|---|
prom_query | Instant PromQL query, rendered as compact labelled series and values. |
prom_query_range | Range query over the last N minutes; per-series points, first, last, min, max. |
prom_alerts_explain | Active alerts joined with alerting-rule expressions, rule group, for duration, and annotations. |
prom_label_values | Lists real values of a label (optionally scoped), so the agent learns actual job/instance names. |
prom_series_discover | Checks which series exist for a label matcher, so the agent stops hallucinating metric names. |
Resources: prometheus://alerts (explained alerts), prometheus://config. Prompt: triage.
Try it with no server
prom-mcp demo        # fixture-backed self-test: query, alert explanation, series discovery
prom-mcp query 'up'  # one-shot CLI query against $PROM_URL
Configuration
| Setting | Env var | Config file key |
|---|---|---|
| Prometheus base URL | PROM_URL | base_url |
| Bearer token (auth-protected Prometheus) | PROM_TOKEN | token |
| Request timeout | PROM_TIMEOUT (e.g. 30s) | timeout_seconds |
| Config file path | PROM_CONFIG |
Config file is JSON, looked up at $PROM_CONFIG, then ./prom-mcp.json, then ~/.prom-mcp.json:
{ "base_url": "https://prometheus.example.com", "token": "…", "timeout_seconds": 30 }
Env vars override the file. No config at all defaults to http://localhost:9090.
Why not just give the agent raw API access?
Agents drown in raw Prometheus JSON and invent metric names that do not exist. prom-mcp returns terse, labelled, triage-shaped text and makes the agent discover before querying. That is the difference between an agent that guesses and an agent that investigates.
Single Go binary, zero dependencies, works fully offline against your own Prometheus.
Comparing servers? See docs/comparison.md for an honest side-by-side with pab1it0/prometheus-mcp-server and the Prometheus org's prometheus/prometheus-mcp.
FAQ
Which AI clients work with prom-mcp? Any MCP client: Claude Code, Cursor, Windsurf, Zed, and custom agents. It speaks newline-delimited JSON-RPC 2.0 over stdio.
How do I connect prom-mcp to a remote Prometheus?
Set PROM_URL to your Prometheus base URL (for example http://localhost:9090 or your internal endpoint) when adding the server.
Can an AI agent explain why a Prometheus alert is firing?
Yes. prom_alerts_explain joins active alerts with the rule that fired them (expression, summary, description), so the agent can reason about the cause instead of reporting raw JSON.
Does prom-mcp need any API keys or cloud services? No. It is a single local binary talking only to your Prometheus.
How does prom-mcp compare to the other Prometheus MCP servers? See docs/comparison.md. Short version: prom-mcp is the focused alert-triage option with 5 tools; the others cover more of the Prometheus API or ship more deployment machinery.
How is this different from exposing the Prometheus HTTP API to an agent? Raw API access returns nested JSON the agent must parse and invites invented metric names. prom-mcp renders compact labelled text, joins alerts with the rules that fired them, caps long outputs, and nudges discovery before querying. It also retries transient failures and supports bearer-token auth.
Does it work with a remote or auth-protected Prometheus?
Yes: set PROM_URL and PROM_TOKEN (or a JSON config file). See Configuration.
Which Prometheus versions are supported?
Any server exposing the standard HTTP API (/api/v1/query, query_range, alerts, rules, series, label/<name>/values).
License
MIT. See LICENSE.