PostgreSQL Performance (read-only)
Read-only PostgreSQL performance diagnostics: slow queries, EXPLAIN, index advice, locks, functions
Runs on your machine from its package; the steps are below.
What it does
- Reads
- Writes
- High impact
Not assessed yet.
What it costs
FreeOdel charges nothing per call. The publisher may charge for its own service.
Runs locally over stdio
This server isn't hosted — your MCP client launches it from a package registry. Use one of the commands below, or drop the config into your client (e.g. Claude Desktop).
Run
docker run -i --rm ghcr.io/gouranshul/pg-perf-mcp:0.1.0
MCP client config
{
  "mcpServers": {
    "postgresql-performance-read-only": {
      "command": "docker",
      "args": [
        "run",
        "-i",
        "--rm",
        "ghcr.io/gouranshul/pg-perf-mcp:0.1.0"
      ]
    }
  }
}pg-perf-mcp



An MCP server that lets AI assistants diagnose PostgreSQL performance problems safely: slow queries, EXPLAIN plans, index suggestions, table health and lock contention. It is read-only by design.
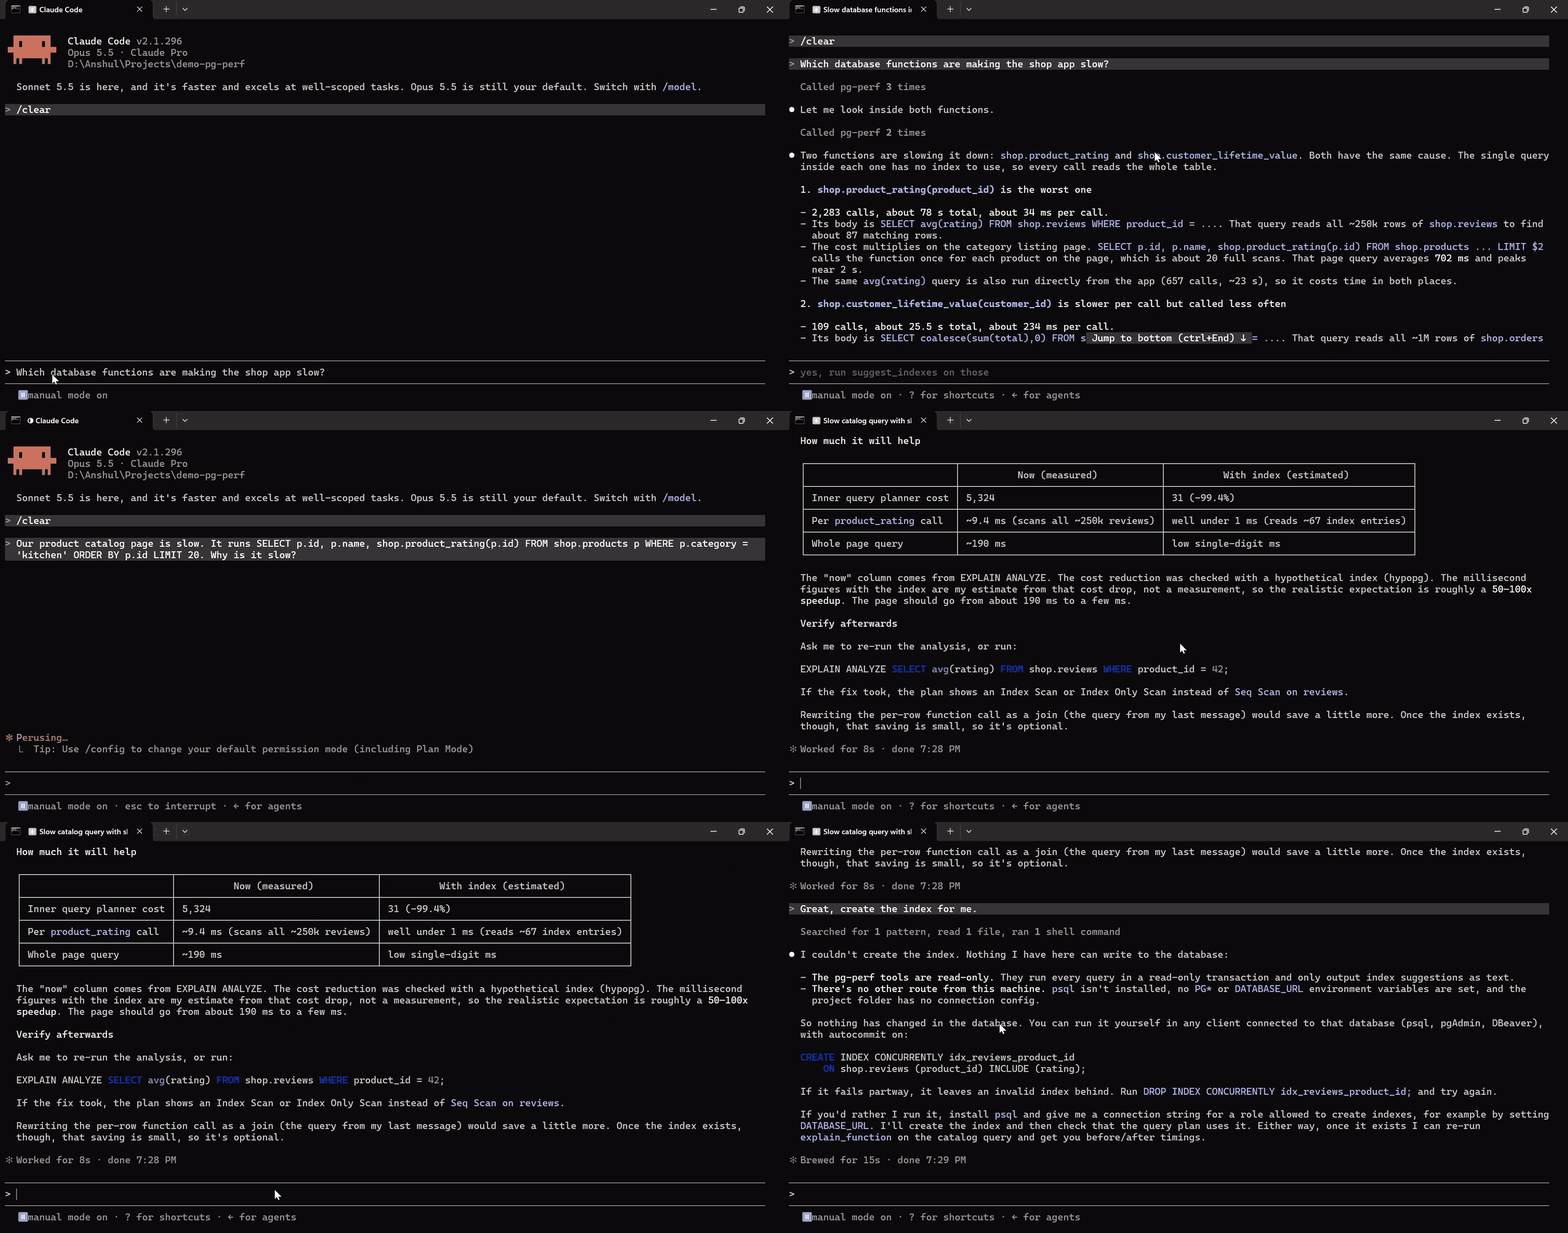
A real Claude Code session against the demo shop, sped up. First it finds which database functions are slow and why. Then it explains a slow catalog query and estimates the fix with a hypothetical index. Asked to create the index, it says it can't: every tool is read-only.
Why
When a page is slow, developers paste a query into a chat and ask "why is this slow?". The assistant then guesses, because it cannot see the plan, the table sizes, the existing indexes or which queries actually dominate the load.
pg-perf-mcp gives the assistant real numbers from pg_stat_statements, EXPLAIN and the
catalogs, through a narrow, audited, read-only interface. It cannot change data, cannot run DDL,
and never creates the indexes it recommends.
Demo
A condensed, illustrative session against the demo shop (docker compose up, then
./demo/workload.sh). Exact numbers vary from run to run:
You:    The shop database feels slow. What's going on?

Claude: [top_slow_queries orderBy=total_time]
        The top statement by total time is
          SELECT id, status, total, created_at FROM shop.orders WHERE customer_id = $1 ORDER BY created_at DESC
        (thousands of calls, the largest share of total execution time).

        [explain_query sql="... WHERE customer_id = 42 ORDER BY created_at DESC"]
        HIGH  SEQ_SCAN_ON_LARGE_TABLE  Seq Scan on shop.orders
              reads all ~1.0M rows of shop.orders to apply filter (customer_id = 42); only a handful match.

        [suggest_indexes]
        CREATE INDEX CONCURRENTLY idx_orders_customer_id ON shop.orders (customer_id);
        hypopg: the planner would use it; estimated cost drops by well over 90%.
        Not executed. Review it and run it yourself, ideally off-peak.

        [table_health table=shop.orders]
        Autovacuum is disabled on shop.orders and ~20% of rows are dead. Re-enable autovacuum and VACUUM.

        Prioritized actions: 1) add the index above (orders.customer_id is a foreign key with no index),
        2) re-enable autovacuum on shop.orders, 3) ...
Architecture
flowchart LR
    A["AI assistant<br/>(Claude Code, Claude Desktop, ...)"] -- "MCP over streamable HTTP<br/>Authorization: Bearer key" --> F["API key filter<br/>(constant-time)"]
    F --> M["MCP tools / resources / prompt<br/>Spring AI 2.0 annotations"]
    M --> R["ToolRunner<br/>audit log · metrics · safe errors"]
    R --> G["SqlGuard<br/>PG lexer + JSqlParser"]
    G --> E["ReadOnlyExecutor<br/>READ ONLY tx · always rollback<br/>statement/lock timeout · row cap"]
    R --> AN["analysis<br/>PlanAnalyzer · IndexAdvisor<br/>(pure functions)"]
    E --> P[("PostgreSQL 18<br/>role mcp_readonly<br/>pg_stat_statements · hypopg")]
Tools
| Tool | What it does | Safety notes |
|---|---|---|
top_slow_queries | Most expensive statements from pg_stat_statements: normalized text, calls, total/mean/max ms, rows, cache hit ratio, share of total time. Order by total_time, mean_time, calls or rows. | Fixed SQL; sort column chosen from an enum. Excludes the server's own statements. |
explain_query | Summarized plan: 5 costliest nodes, seq scans on large tables, 10x row misestimates, disk sorts/hash spills, nested loops with many iterations. analyze=true adds real timings. $1 placeholders get a generic plan. | SQL guard first. ANALYZE runs in a read-only transaction that is rolled back and cancelled after the timeout. |
suggest_indexes | CREATE INDEX CONCURRENTLY candidates from filtered seq scans, join keys and ORDER BY ... LIMIT, each with a reason; validated with hypothetical indexes when hypopg is installed. | Never executed. Hypothetical indexes are reset in a savepoint so they cannot leak to other calls. |
unused_indexes | Indexes with idx_scan = 0, largest first, excluding primary key, unique and constraint indexes; includes size, definition and a DROP INDEX CONCURRENTLY to review. | Nothing is dropped. Reports when stats were last reset. |
table_health | Live/dead tuples, dead ratio, last (auto)vacuum/analyze, rows changed since analyze, seq vs index scans, sizes, with plain-language warnings. | Catalog reads only. |
blocking_sessions | Blocked/blocking pairs via pg_blocking_pids, truncated query texts, wait time, lock type/mode/table, blocker state, root blockers. | Never cancels or terminates anything. |
slow_functions | User-defined functions (PL/pgSQL, SQL, ...) ranked by total, self or mean time or calls, from pg_stat_user_functions, with language and volatility. | Catalog reads only. Needs track_functions. |
explain_function | Looks inside the functions a query calls: time per function, every statement executed inside them with calls, time and its own analyzed plan, and findings such as a seq scan inside a function, a function called once per row, or a read-only function left VOLATILE. Includes the function source. | SQL guard first; runs in the same rolled-back read-only transaction as explain_query, so functions that write fail. auto_explain is switched on for that transaction only, with generic plans so no data values appear. |
Resources: pg://schema/overview (tables, row estimates, sizes, indexes) and
pg://schema/{table} (columns, indexes with scan counts, foreign keys flagged when unindexed).
Prompt: diagnose_slow_database, a guided workflow: slow queries, then explain, suggest
indexes, table health, functions, then a prioritized summary.
Why a separate tool for database functions
EXPLAIN shows a function call as one opaque expression, and charges its time to whichever plan
node evaluates it. On the demo catalog page (20 products, each calling shop.product_rating),
explain_query blames the index scan on products (184 ms self time) and finds nothing else
serious. explain_function on the same query, against the full demo data:
shop.product_rating          plpgsql  20 calls  99% of execution time
  SELECT avg(rating) FROM shop.reviews WHERE product_id = p_product_id
                             20 calls  175 ms  96% of execution time
HIGH    FUNCTION_DOMINATES_QUERY  shop.product_rating takes 99% of the query's execution time
HIGH    FUNCTION_CALLED_PER_ROW   ran 20 times for one query (9.0 ms per call)
HIGH    SEQ_SCAN_ON_LARGE_TABLE   inside shop.product_rating: Seq Scan on shop.reviews
                                  reads all ~250k rows to apply filter (reviews.product_id = $1)
How it works (ADR 0006): the query runs once
with auto_explain enabled for that transaction only, so the plan of each nested statement comes
back as a notice; per-function time comes from pg_stat_xact_user_functions and per-statement
calls from pg_stat_statements, both as before/after differences.
Security model
Five independent layers stand between the assistant and a write (details in ADR 0001):
- SQL guard: exactly one plain
SELECT. It is checked by a PostgreSQL-faithful lexer and JSqlParser, and both must agree. Blocks DML/DDL, multiple statements, data-modifying CTEs,SELECT INTO,FOR UPDATE/SHARE,COPY,DO, and dangerous functions (pg_sleep*,*_file,lo_*,dblink*,set_config,pg_terminate_backend,query_to_xml, ...). It fails closed. - Read-only role:
mcp_readonlyhasSELECTpluspg_read_all_stats/pg_monitor, withdefault_transaction_read_only = onandstatement_timeout = 5sset on the role. - Read-only connections: Hikari
readOnly=trueand a read-only session default. - One rolled-back read-only transaction per call:
statement_timeout/lock_timeoutset locally,standard_conforming_stringsforced on, always rolled back. - Row cap: every result is capped (default 200 rows).
Around those layers: a bearer API key (constant-time comparison; only /actuator/health is
open), a JSON audit line per call (SQL stored as a SHA-256 hash plus an 80-character preview),
error messages with no stack traces or connection details, and metrics mcp.tool.duration and
mcp.guard.rejections.
Quickstart
Requirements: Docker. There are two ways to start:
- Use it on your database: pull the published image. No clone or build.
- Try the demo shop: clone the repo and get a seeded database with realistic problems to diagnose.
Either way, finish with connecting your AI client.
Use it on your database
1. Pull the image (public on GHCR, built for amd64 and arm64):
docker pull ghcr.io/gouranshul/pg-perf-mcp:0.1.0
2. Prepare the database (once). Create a read-only role like mcp_readonly (see
docker/init.sql) and make sure pg_stat_statements is in
shared_preload_libraries. Prefer a replica or staging database: analyze=true and
explain_function execute the query. For the function tools, also
enable function tracking.
3. Run it. Put the settings in a file so secrets stay out of your shell history:
cat > pg-perf.env <<'EOF'
PGPERF_DB_URL=jdbc:postgresql://host.docker.internal:5432/mydb
PGPERF_DB_USER=mcp_readonly
PGPERF_DB_PASSWORD=<the role's password>
MCP_API_KEY=<32+ random characters>
EOF
docker run --rm --env-file pg-perf.env -p 127.0.0.1:8080:8080 ghcr.io/gouranshul/pg-perf-mcp:0.1.0
host.docker.internal reaches a database on your machine (Docker Desktop; on Linux add
--add-host=host.docker.internal:host-gateway). The MCP endpoint is now
http://localhost:8080/mcp.
4. Connect your AI client: see below.
Try the demo shop
To build and test from source you also need Java 25.
git clone https://github.com/gouranshul/pg-perf-mcp && cd pg-perf-mcp
cp .env.example .env        # then replace the placeholder secrets
docker compose up --build   # Postgres 18 + seeded demo shop (~4.5M rows) + the MCP server on :8080
Generate some slow-query statistics (optional, but makes top_slow_queries interesting):
./demo/workload.sh          # 60s of deliberately bad queries via pgbench
./demo/lock-scenario.sh     # holds a row lock for 2 minutes so blocking_sessions has something to show
./demo/smoke-test.sh        # curl-based end-to-end check of health, auth and two tool calls
Connect from Claude Code
claude mcp add --transport http pg-perf http://localhost:8080/mcp --header "Authorization: Bearer $MCP_API_KEY"
In PowerShell, set the key first, or the header goes out empty and the server answers 401:
$env:MCP_API_KEY = "<your MCP_API_KEY>"
claude mcp add --transport http pg-perf http://localhost:8080/mcp --header "Authorization: Bearer $env:MCP_API_KEY"
Then ask: "Use pg-perf to find out why the shop database is slow", or run the
diagnose_slow_database prompt.
Connect from Claude Desktop
Claude Desktop launches stdio servers, so use the mcp-remote bridge
(claude_desktop_config.json):
{
  "mcpServers": {
    "pg-perf": {
      "command": "npx",
      "args": ["-y", "mcp-remote", "http://localhost:8080/mcp", "--header", "Authorization:${AUTH_HEADER}"],
      "env": { "AUTH_HEADER": "Bearer <your MCP_API_KEY>" }
    }
  }
}
Connect from Cursor
~/.cursor/mcp.json (or .cursor/mcp.json in a project):
{
  "mcpServers": {
    "pg-perf": {
      "url": "http://localhost:8080/mcp",
      "headers": { "Authorization": "Bearer <your MCP_API_KEY>" }
    }
  }
}
Connect from VS Code (Copilot agent mode)
.vscode/mcp.json. VS Code prompts for the key once and stores it securely:
{
  "inputs": [
    { "type": "promptString", "id": "pg-perf-key", "description": "pg-perf MCP_API_KEY", "password": true }
  ],
  "servers": {
    "pg-perf": {
      "type": "http",
      "url": "http://localhost:8080/mcp",
      "headers": { "Authorization": "Bearer ${input:pg-perf-key}" }
    }
  }
}
Enable the function tools (optional)
slow_functions and explain_function need two extra settings on your own database. The demo
shop already has them, and every other tool works without them:
-- postgresql.conf: track_functions = 'pl' (or 'all' to include SQL functions), then reload.
-- Load auto_explain for this role only (no restart needed); it stays inactive until a call enables it:
ALTER ROLE mcp_readonly SET session_preload_libraries = 'auto_explain';
-- PostgreSQL 15+: let the role change only these settings, only for its own transactions:
GRANT SET ON PARAMETER auto_explain.log_min_duration, auto_explain.log_analyze,
    auto_explain.log_nested_statements, auto_explain.log_format, auto_explain.log_level,
    auto_explain.log_verbose, auto_explain.log_parameter_max_length TO mcp_readonly;
Without these, explain_function still reports what it can and says in notes what is missing.
Configuration
| Variable / property | Default | Purpose |
|---|---|---|
MCP_API_KEY | (required) | Bearer token clients must send; at least 16 characters. The server will not start without it. |
PGPERF_DB_URL | jdbc:postgresql://localhost:5432/shop | JDBC URL |
PGPERF_DB_USER / PGPERF_DB_PASSWORD | mcp_readonly / (empty) | Database credentials (use a read-only role) |
pgperf.query.statement-timeout | 5s | Per-call statement_timeout and lock_timeout |
pgperf.query.max-rows | 200 | Row cap for every query |
pgperf.guard.max-sql-length | 20000 | Longest SQL accepted |
pgperf.functions.nested-plan-threshold | 1ms | explain_function keeps the plan of a statement inside a function only for executions at least this long (every execution is still counted) |
OTEL_TRACING_ENABLED | false | Export traces via OTLP/HTTP |
OTEL_EXPORTER_OTLP_ENDPOINT | http://localhost:4318/v1/traces | OTLP traces endpoint |
OTEL_TRACING_SAMPLING_PROBABILITY | 1.0 | Trace sampling ratio |
Properties can also be set as environment variables (PGPERF_QUERY_STATEMENT_TIMEOUT=3s, ...).
Metrics are at /actuator/prometheus (requires the API key).
Build and test
./mvnw verify
This runs unit tests, Testcontainers integration tests against PostgreSQL 18 (same image, init
scripts and read-only role as compose; needs Docker), an end-to-end test with the MCP Java SDK
client over HTTP, and a JaCoCo gate (80% lines on the guard and analysis packages).
Design decisions
- 0001: Read-only by design, enforced in depth
- 0002: Streamable HTTP transport
- 0003: Summarized plans instead of raw EXPLAIN
- 0004: Suggest indexes, never execute them
- 0005: Platform versions and API differences
- 0006: Looking inside database functions
Roadmap
- OAuth 2.1 resource server per the MCP authorization spec (per-user identity instead of a shared key)
- Multiple named database targets, with read replicas preferred
- Workload-level index advice (weigh candidates across all top queries, not one at a time)
auto_explainlog /pg_stat_kcacheingestion for plans of queries that already ran in production- Optional raw-plan output and per-tool rate limits
- MCP elicitation to confirm
analyze=trueon expensive queries
License
MIT © 2026 Anshul Gour