

Preflight
Observability for AI Coding Assistants




Docs • What's New • Examples • Community • Contributing
Why Your AI Tool Needs Observability
Your AI coding assistant makes hundreds of decisions every session — what to read, what to edit, when to run commands. But you can't see any of it. You know it was fast, but was it efficient? You got a PR merged, but how much did it cost? You fixed a bug, but did it get stuck in a loop first?
Preflight is observability for agentic coding — the actions, cost, and efficiency of your AI coding assistant as it works. See exactly what's happening, how much it costs, and where your AI is wasting time.
Local-first by design. Preflight runs entirely on your machine and sends your data nowhere by default. A live dashboard at localhost:7777 shows your sessions in real time, fully offline. Connect a New Relic account only when you want more — team rollups, alerting, and cross-session history. You choose: local-only, New Relic, or both.
Demo
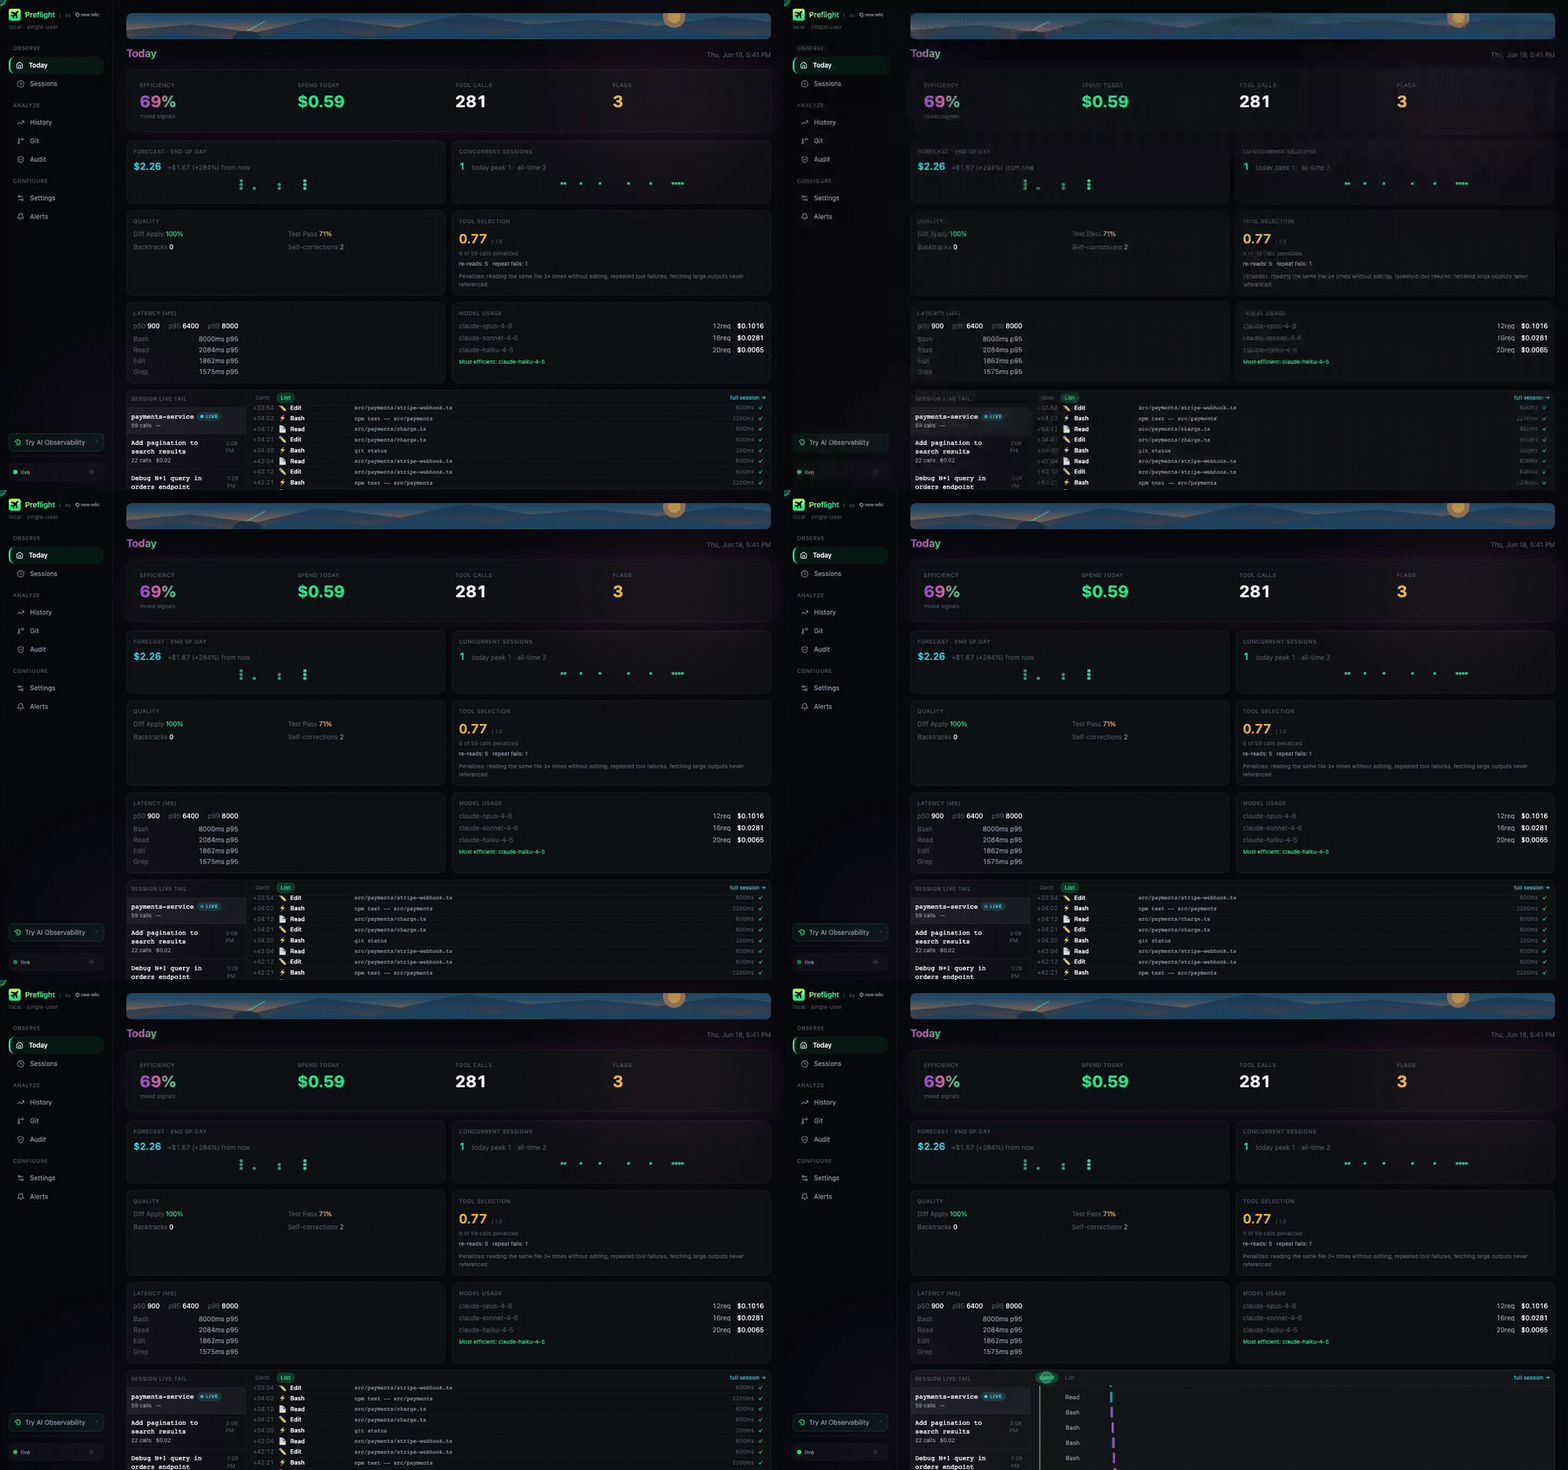
See cost breakdown, efficiency scoring, anti-patterns, and live session tracking in action.
What You Get
Visibility
- Every action captured — file reads, edits, commands, searches
- Live session dashboard — see what's happening right now
- Historical trends — analyze patterns over weeks and months
Cost Control
- USD spend tracking — per session, day, and week
- Per-model and cache breakdown — know which models cost most and how efficiently context is reused
- Budget alerts — get notified before you overspend
- Forecasting — project monthly burn rate
Efficiency Insights
- Efficiency score — 0–100 score per task, based on how directly the AI worked
- Anti-pattern detection — catches re-reads, blind edits, stuck loops
- Personalized recommendations — optimize your AI workflow
- Weekly coaching reports — narrative analysis vs. your historical baseline
Dashboards
- Local dashboard — live session view at
localhost:7777, no account required - 8 pre-built New Relic dashboards — deploy in seconds (New Relic mode):
- Overview — session stats, cost summary, top tools
- Personal — 30-day self-reflection scoped to you
- Session Detail — deep-dive into a single session's tool calls
- Team View — aggregated cost and efficiency across developers
- Manager View — high-level team metrics, no tool-call content
- Adoption & Cost — adoption momentum, spend, MCP usage, and per-developer outcomes for engineering managers
- Platform Comparison — Claude Code vs. Cursor vs. Windsurf, etc.
- Security Audit — audit trail of sensitive file access
Quick Start
1. Install
npm install -g @newrelic/preflight
Using Smithery? Installing Preflight from the Smithery MCP registry wires up the MCP server for you, but Smithery has no mechanism to write Claude Code hooks. After install, ask Claude Code to call the
nr_observe_install_hooksMCP tool (it will offer to do this automatically oncenr_observe_healthreportssetup_required: true), then restart Claude Code to activate monitoring.
2. Run setup
preflight setup
The wizard defaults to local mode — press Enter through the prompts and you're set. It wires Preflight into your AI tool (hooks + MCP server) and writes config to ~/.newrelic-preflight/. Takes under a minute, no account required.
Using GitHub Copilot? The wizard also asks to install Copilot hooks — saying yes configures both the Copilot CLI and VS Code Copilot Chat automatically (hooks, MCP registration, and the fix for VS Code's hook double-capture), so Copilot gets the same tool-call and cost metrics Claude Code does. Run it standalone anytime with
preflight install --copilot. See docs/ADAPTERS.md for details.
When prompted, pick a mode:
| Mode | What it does | New Relic account? |
|---|---|---|
| local (default) | Everything stays on your machine; live dashboard at localhost:7777 | Not needed |
| cloud | Ships telemetry to New Relic | Required |
| both | Local dashboard and New Relic | Required |
3. Start coding
Restart your AI tool — hooks and the MCP server load at session start. Every tool call is captured automatically. Open http://localhost:7777 to watch your session live.
Using Kiro? Add Preflight as a Kiro Power for the
nr_observe_*query tools — see the doc for install steps and how to add automatic tool-call capture on top.
Using Claude Code? You can skip the npm install above and add Preflight as a Claude Code plugin instead:
/plugin marketplace add newrelic-experimental/preflight
/plugin install newrelic-preflight@newrelic-preflight-marketplace
Other ways to install
Cursor — Add to Cursor installs the MCP server via a one-click deeplink; run preflight setup afterwards for hook capture.
Works With
Claude Code • Cursor • Windsurf • GitHub Copilot • Zed • Continue.dev • Amazon Q Developer • Amazon Kiro
Coverage isn't uniform — some platforms capture every built-in tool call, others (Zed, Continue.dev) only see calls routed to Preflight's own MCP tools. See ADAPTERS.md for what each platform can and can't observe, and per-platform setup steps.
Connect New Relic (optional)
Local mode is fully featured on its own. Connect a New Relic account to unlock:
- Team & manager dashboards across multiple developers
- Alerting on cost spikes, low efficiency, and stuck loops
- Cross-session history, trends, and weekly coaching reports
Re-run preflight setup and choose cloud or both, or configure it non-interactively:
preflight install \
  --mode cloud \
  --license-key YOUR_LICENSE_KEY \
  --account-id YOUR_ACCOUNT_ID
EU accounts add --eu. FedRAMP accounts add --fedramp. Japan accounts add --jp.
Then deploy the prebuilt dashboards:
NEW_RELIC_API_KEY=NRAK-... NEW_RELIC_ACCOUNT_ID=12345 \
  preflight deploy-dashboards --all
You'll need a license key (telemetry ingest) and your account ID, plus a user API key (NRAK-…) to deploy dashboards and alerts. See ADVANCED.md for alerts, OTLP export to other backends, and Terraform.
No dashboard until you run
deploy-dashboards. Cloud mode ships telemetry to New Relic as soon as it's configured, but nothing creates a dashboard automatically — that's the separate step above, and it needs a different credential (a user API key, not your license key). Until you run it, there's no UI to look at. In the meantime, query the raw events directly in New Relic's Query Builder, e.g.:SELECT * FROM AiToolCall SINCE 1 hour agoOnce
deploy-dashboardssucceeds, find the dashboards under your New Relic account's Dashboards section.
Data ingest note: Telemetry sent to New Relic counts against your account's data ingest. On paid plans, standard ingest rates apply. Monitor your usage under NR One → Data Management → Data Ingestion.
Requirements
Required
- Node.js v22 or higher (get it or use nvm)
- An AI coding tool (Claude Code recommended for deepest integration)
Optional
- New Relic account — only for
cloud/bothmode. Skip it to run local-only (the default). - User API key (
NRAK-…) — only needed to deploy dashboards and alerts
Other Commands
preflight doctor               # Run 10 diagnostic checks and print actionable fix commands
preflight validate             # Check config for syntax errors and unknown keys
preflight update               # Pull latest version, rebuild, and offer to restart a running dashboard (source installs only — npm installs: npm install -g @newrelic/preflight@latest)
preflight local                # List running --local dashboard processes and live --stdio MCP processes
preflight local --clean        # Kill orphaned --local processes and --stdio processes with a missing binary (prompts for confirmation)
preflight uninstall            # Remove hooks and MCP config (prompts with a summary first)
preflight uninstall --yes      # Skip the confirmation prompt (for scripts and CI)
preflight uninstall --daemon   # Remove only the background dashboard daemon
Add --project to install/uninstall to scope changes to the current directory only.
WSL users: preflight setup will ask which Claude Code you're running. You can also set it explicitly:
--windows-cc— Windows Claude Code (the desktop app); useswsl.exehooks and Windows paths--linux-cc— Linux Claude Code installed via npm inside WSL
Documentation
- ADVANCED.md — Configuration, dashboards, alerts, Terraform
- SCORECARDS.md — New Relic Scorecard rules for team attribution
- ARCHITECTURE.md — Data flow, component reference, and operating modes
- ADAPTERS.md — Per-platform integration mechanism, setup steps, and known gaps
- TROUBLESHOOTING.md — Common setup and connection problems, and how to fix them
- CONTRIBUTING.md — Development, testing, submitting PRs
- SECURITY.md — Security guidelines and best practices
- PRIVACY.md — Data collection inventory and pre-cloud checklist
From Source
Develop, test, or run the latest unreleased version:
git clone https://github.com/newrelic-experimental/preflight
cd preflight
nvm use              # Switch to Node v24
npm install          # Install dependencies
npm run build        # Compile TypeScript
npm link             # Register preflight on PATH
Then run preflight setup as usual.
License
Preflight is open source under the Apache License 2.0.
Contributing
We welcome contributions! See CONTRIBUTING.md for how to get started. Join the New Relic Community to share ideas, ask questions, or discuss features.
Built by New Relic • Designed for developers who use AI