
Units-LE
Extract durations, sizes, percentages and frequencies in one base unit, refusing ambiguous ones.
Runs on your machine from its package; the steps are below.
What it does
- Reads
- Writes
- High impact
Not assessed yet.
What it costs
FreeOdel charges nothing per call. The publisher may charge for its own service.
Runs locally over stdio
This server isn't hosted — your MCP client launches it from a package registry. Use one of the commands below, or drop the config into your client (e.g. Claude Desktop).
Run
npx -y units-le-mcp
MCP client config
{
  "mcpServers": {
    "units-le": {
      "command": "npx",
      "args": [
        "-y",
        "units-le-mcp"
      ]
    }
  }
}

Units-LE: One Quantity, One Unit
Find every quantity in a document — durations, sizes, percentages, frequencies — with its value in one base unit, and refuse the ambiguous ones by name
YAML · TOML · JSON · INI · dotenv · CSV · and anything else, scanned as text




Useful? A star or rating is how other developers find it — ★ GitHub · ★ Open VSX · ★ Marketplace
What it does
timeout: 30s in one service and timeout: 30000 in another are the same number of milliseconds, and nothing about the text says so. memory: 1GB and memory: 1GiB differ by 7% and look identical at a glance.
Run Units-LE: Extract Quantities and every quantity in the active document — a number welded to a unit — opens in a report beside the editor: as the document wrote it, in one base unit so two of them can be compared, with its line, column and key path. A quantity it cannot read unambiguously keeps its row and gets a reason instead of a guess. Works in VS Code and in VS Code–based editors like Cursor and VSCodium (installable from Open VSX).
- Before a migration — every timeout and memory limit in a values file, in milliseconds and bytes
- Reviewing a config change — the
500mthat means minutes to one reader and millicores to another - Against a runbook or a retention policy — the limit the document states, checked against the one the config sets
- Across a project — every file that holds a quantity, and how many, in one table
It never rewrites a document, and never guesses.
Install
| Where | What you get | Install |
|---|---|---|
| VS Code | The report, in your editor, on a keystroke | Marketplace |
| Cursor, VSCodium, Windsurf | The same extension | Open VSX |
| A terminal or a CI step | A whole tree, with exit codes | cargo install units-le · crates.io |
| Any MCP agent, via Node | extract_units over stdio | npx units-le-mcp · npm |
A refusal is a finding
This is the whole product. Any tool can multiply 30s by a thousand;
what makes this one usable in a review is that it will not pretend.
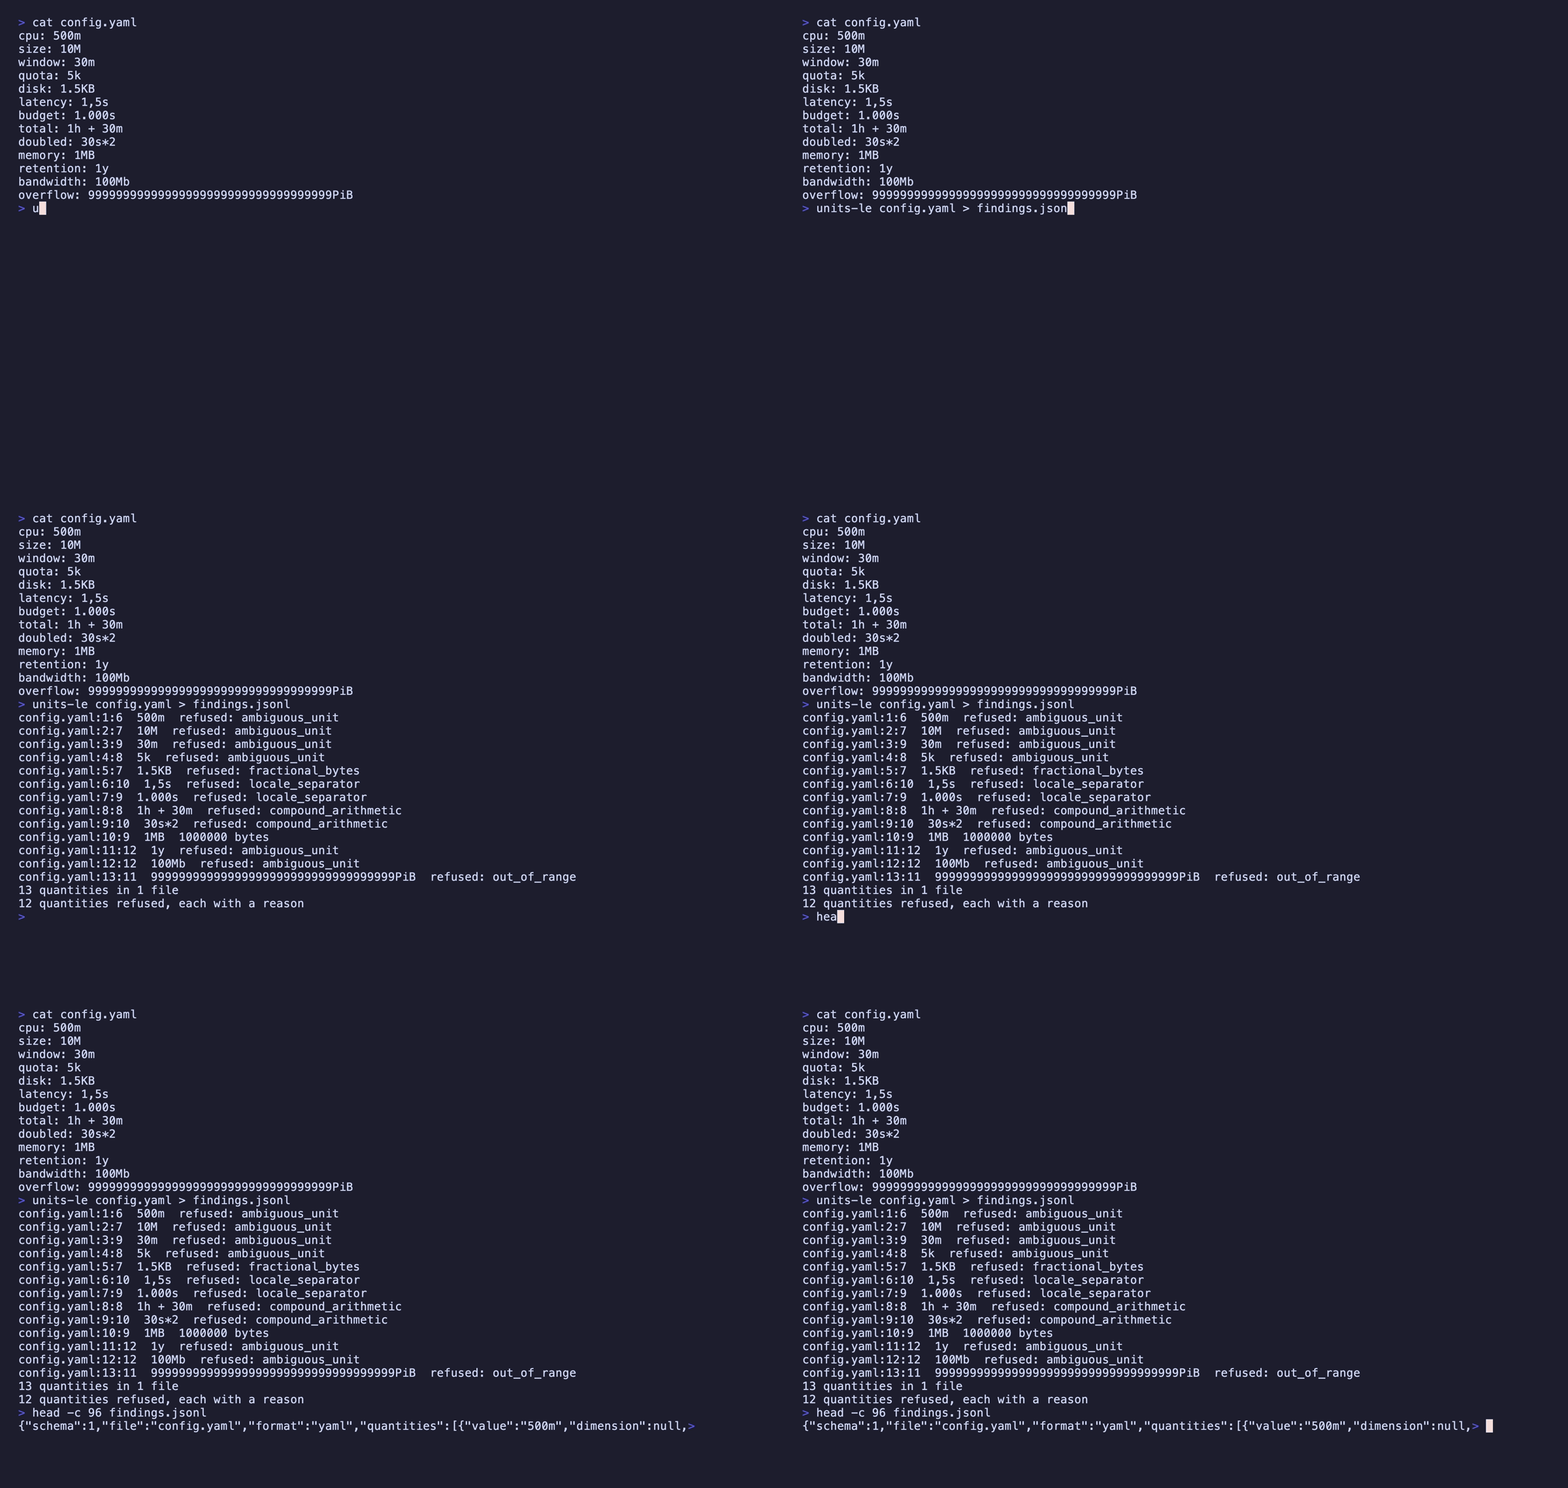
| It sees | Reason | What comes back |
|---|---|---|
500m, 10M, 5k, 1y, 100Mb | ambiguous_unit | no base value — m is minutes, milliseconds or Kubernetes millicores; M is mega- or minutes; k/K/G/T/P are prefixes with no unit after them; a calendar year has no fixed length; a lowercase b is bits by the standard and bytes in most software that writes it |
1.5KB, 1.5KiB | fractional_bytes | no base value — a byte count has no fractional part. 1.5KiB is exactly 1536 bytes and is still refused: the refusal is about the category, not the arithmetic |
1,5s, 1.000s, 1.2.3s | locale_separator | no base value — one and a half, or fifteen hundred? This tool does not infer a locale. Narrowed so 0.825s and 2.5s read normally |
1h + 30m, 30s*2 | compound_arithmetic | no base value — an expression, not a quantity, reported as one finding rather than two |
1MB, 256KB | si_iec_hazard | the base value, plus the reason — see below |
99999…PiB | out_of_range | no base value — it does not fit in 128 bits, and is refused rather than wrapped |
Every one of them keeps its row, its source text, its position and a sentence a person can act on. A refusal is never a dropped row and never a guess.
si_iec_hazard annotates; it does not withhold
It is the one reason that still answers. MB is 10^6 by the standard,
so 1MB comes back as 1000000 bytes and carries
reason: "si_iec_hazard" — because a great deal of software writes
MB and means 2^20. Reporting nothing would be less useful than
reporting the standard answer with the flag attached, and picking 2^20
would be the guess this tool exists not to make.
So it is not counted as refused. A row with si_iec_hazard is the
only row that carries both a base and a reason; every other reason
means the base is null.
A bare number with no unit is not a finding at all. timeout: 30
yields nothing here — that is
numbers-le's question, and
the boundary is what keeps the two tools distinct.
Four dimensions
| Dimension | Base unit | Units read |
|---|---|---|
duration | milliseconds | ns us µs μs ms s sec secs min mins h hr hrs d day days w · compounds 1h30m · ISO-8601 PT1H30M P1DT2H P2W PT0.5S |
bytes | bytes | B · SI kB KB MB GB TB PB · IEC KiB MiB GiB TiB PiB · Kubernetes Ki Mi Gi Ti Pi |
percent | ratio | % — 15% is 0.15 |
frequency | hertz | Hz kHz KHz MHz GHz THz |
Case is part of the symbol. MB is a megabyte and Mb is a
megabit; folding them would silently multiply by eight, so Mb is
refused rather than treated as a synonym.
1h30m is a grammar and 1h + 30m is arithmetic. The first is one
quantity written in two parts. Inside a compound the parts disambiguate
each other — m alone is refused, and m between h and s can only
be minutes, because a compound is written largest-first. That ordering
is required rather than assumed, so 30s1h is not a quantity at all.
Physical units are a non-goal, not a gap. Length, mass, temperature
belong to a different question, and reading them would mean unit algebra
(m/s²), which is what uom is for. See
crate/SPEC.md.
Formats
JSON, YAML, CSV, TOML, INI and dotenv are parsed. Everything else is scanned as text — a Kubernetes manifest, a Terraform file, a Markdown table of limits, a log — so the files where quantities actually live yield them rather than nothing.
Unlike numbers-le's text scan, this one has a shape to look for, so
v1.2.3 yields nothing rather than two numbers. Every format with a
shape carries a key path — cache.ttl, limits[0], server.timeout,
TIMEOUT — and every finding carries a 1-based line and column, the
column in UTF-16 units, which is the number your editor shows.
Its false-positive class is measured rather than imagined. A run
inside an opaque blob still reads as a quantity: 001d in a UUID is one
day, and a base64 hash ending /2w== is two weeks. The boundary
characters that let those through are the same ones that let -30s and
ttl=30s through. Over crate/fixtures/documents/opaque.txt — 280
lines of lockfile hashes, container digests, git object names, UUIDs and
signing material, none of which is a quantity — the scan reports 5
false findings, 1.8%, and a test prints that number on every run.
Each one carries its line and column, which is what makes it a row you
discard rather than a number you trust.
It has no opinions
No "this timeout is too low". No defaults database. No conversion flag, no rewriting, no arithmetic. It reports what a document says and what that means in one base unit; which limits are right is the reviewer's call.
Across a folder or a workspace
Extract reads the document you have open. A scan reads many files from disk and gives one report.
- The whole workspace: run
Units-LE: Scan Workspace for Quantitiesfrom the command palette. - One folder: right-click it in the Explorer and choose
Scan Folder for Quantities, or runUnits-LE: Scan Folder for Quantitiesand pick one.
The report opens with a table of every file that holds something, then has a section per file:
# Units-LE workspace report

`my-project` · 113 file(s) read · 3 quantit(ies), 1 could not be resolved

| File | Quantities | Could not be resolved |
|---|---|---|
| `deploy/values.yaml` | 3 | 1 |

## `deploy/values.yaml` · yaml (3)

- **2:8** · `1h30m` · duration · → `5400000` milliseconds · key `cache.ttl`
- **3:9** · `512MiB` · bytes · → `536870912` bytes · key `memory`
- **4:7** · `2GB` · bytes · → `2000000000` bytes · key `disk`

> 2 file(s) larger than the safety limit were not read.
What a scan reads. Files come from disk, so an unsaved edit is not seen. A file over the safety size, or one that is not UTF-8 text, is left unread. It stops at 5,000 files or 10,000 listed quantities. The report ends with a line for each thing it left out, so a short report is never mistaken for a clean project.
What it skips, and how to change that. Three switches are on by default, and each can be turned off on its own in Settings:
| Switch | Skips |
|---|---|
scanUseDefaultExcludes | Dependency folders, build output, tool caches and lockfiles. The full list is below |
scanRespectGitignore | Whatever the project's .gitignore files skip |
scanSkipBinaryFiles | Images, fonts, archives and other files that are not text |
Two lists adjust the result without turning a switch off. To skip more, add a pattern to scanExcludes. To read something a switch would skip, add it to scanAlwaysInclude:
{
	// Also skip the test fixtures.
	"units-le.workspace.scanExcludes": ["**/fixtures/**"],
	// Read the vendored code, though the built-in list skips it.
	"units-le.workspace.scanAlwaysInclude": ["**/vendor/**"]
}
Units-LE: Open Settings opens all of these in the Settings editor.
The built-in list
Folders, wherever they appear:
.git, .hg, .svn, node_modules, bower_components, jspm_packages, .pnpm-store, .yarn, vendor, site-packages, Pods, Carthage, dist, build, out, target, _build, _site, dist-newstyle, zig-out, storybook-static, cdk.out, DerivedData, CMakeFiles, .next, .nuxt, .output, .svelte-kit, .angular, .astro, .docusaurus, .vuepress, .expo, .turbo, .parcel-cache, .cache, .sass-cache, .jekyll-cache, .dart_tool, .pub-cache, .gradle, .kotlin, .cxx, .externalNativeBuild, captures, ephemeral, .symlinks, .swiftpm, .build, .bundle, .stack-work, .zig-cache, .godot, elm-stuff, .vercel, .netlify, .serverless, .aws-sam, .terraform, .venv, venv, __pycache__, .tox, .nox, .mypy_cache, .pytest_cache, .ruff_cache, .ipynb_checkpoints, .eggs, coverage, htmlcov, .nyc_output, .vscode-test, .idea, .vs, xcuserdata, *.egg-info
Files, wherever they appear:
*.min.js, *.min.css, *.map, *.snap, *.lock, package-lock.json, pnpm-lock.yaml, npm-shrinkwrap.json, go.sum, *.pbxproj, *.iml, local.properties, output-metadata.json, .flutter-plugins, .flutter-plugins-dependencies, .packages, Generated.xcconfig, flutter_export_environment.sh, GeneratedPluginRegistrant.*, fastlane/report.xml, fastlane/test_output/**, doc/api/**
Not on the list, because they are ordinary folders in many projects: bin, obj, tmp, logs, public, generated. A project that generates those ignores them in git, and the scan reads .gitignore.
What it could not resolve. Across a project there can be many, and they crowd out the rest. So a scan counts them per file in the table and does not list them. units-le.workspace.scanIncludeRefusals lists each one with its reason, and units-le.workspace.scanProblemsEnabled also puts them in the Problems panel, where each is a line you can click.
The settings that shape a scan are under Settings.
Positions
Each row leads with the line and column of the quantity:
- **2:8** · `1h30m` · duration · → `5400000` milliseconds · key `cache.ttl`
Turn units-le.showPositions off and the same row is:
- `1h30m` · duration · → `5400000` milliseconds · key `cache.ttl`
Nothing else changes: the same rows, the same counts. The copy on the clipboard is a separate choice, units-le.clipboardIncludesPositions, so a report can show positions on screen and paste without them. Both apply to a scan as they do to Extract.
Use it from an AI agent
The same engine runs as an MCP server, so an agent can read quantities directly instead of converting units by hand.
| Editor | How |
|---|---|
| VS Code 1.101+ | Nothing to install — the extension registers extract_units with agent mode |
| Claude Code | claude mcp add units-le -- npx -y units-le-mcp |
| Cursor, Windsurf, anything else | point it at npx units-le-mcp |
extract_units(content, format?, filename?, dimension?, maxResults?)
It returns the report the editor renders, as data — quantities capped at 500 by default with meta.truncated. It reads no files and makes no network requests. Published as units-le-mcp on npm and as io.github.nolindnaidoo/units-le in the MCP registry. It answers exactly as the Rust CLI's server does: one corpus runs against both, and a differential test feeds both thousands of generated documents in every format — broken ones included, so each parser's error text is compared too.
Configuring it by hand — any host with an MCP config file
{
  "mcpServers": {
    "units-le": {
      "command": "npx",
      "args": ["-y", "units-le-mcp"]
    }
  }
}
Or install it once with npm install -g units-le-mcp and point at units-le-mcp. It needs no environment variables, no API key and no configuration of its own. To check it:
echo '{"jsonrpc":"2.0","id":1,"method":"tools/list"}' | npx -y units-le-mcp
The CLI
The same extraction runs over a tree from a terminal or a CI step: a Rust CLI in crate/, sharing one corpus with the extension — crate/fixtures/ — so the two can never read a quantity differently.
units-le .                                 # every quantity in the tree, one JSON report per file
units-le --dimension duration config/      # only the timeouts
units-le --strict config/                  # exit 2 if anything was refused
cat values.yaml | units-le --stdin --format yaml
units-le mcp                               # extract_units and units_le_scan over MCP on stdio
Exit codes follow grep — 0 quantities found, 1 none found, 2 the question was malformed. A refusal does not change the exit code; --strict makes it one.
Commands
| Command | Description |
|---|---|
Units-LE: Extract Quantities | Every quantity in the active document, as the editor holds it |
Units-LE: Scan Workspace for Quantities | Every quantity in every file in the workspace, one section per file |
Units-LE: Scan Folder for Quantities | The same for one folder. Also on a folder in the Explorer |
Units-LE: Open Settings | Open Units-LE settings |
Units-LE: Help & Troubleshooting | Built-in documentation |
No command is bound to a key by default. Give any of them one under Keyboard Shortcuts in the editor.
Settings
| Setting | Default | Description |
|---|---|---|
units-le.dimensions | [] | Report only these dimensions; empty reports all four. A refusal that names no dimension is always reported |
units-le.openResultsSideBySide | true | Open the report beside the current editor |
units-le.showPositions | true | Show the line and column of each quantity |
units-le.copyToClipboardEnabled | false | Also copy the report to the clipboard |
units-le.clipboardIncludesPositions | true | Include the line and column in that copy |
units-le.notificationsLevel | silent | all = every notification, important = warnings + errors, silent = errors only |
units-le.workspace.scanPatterns | ["**/*"] | The files a folder or workspace scan reads |
units-le.workspace.scanUseDefaultExcludes | true | Skip dependency folders, build output, caches and lockfiles |
units-le.workspace.scanRespectGitignore | true | Skip what the project's .gitignore files skip |
units-le.workspace.scanSkipBinaryFiles | true | Skip images, fonts, archives and other files that are not text |
units-le.workspace.scanExcludes | [] | More files to skip, as glob patterns |
units-le.workspace.scanAlwaysInclude | [] | Files to read even when one of the three above would skip them |
units-le.workspace.scanMaxFiles | 5000 | The most files one scan reads |
units-le.workspace.scanMaxResults | 10000 | The most quantities one scan lists before it stops reading |
units-le.workspace.scanIncludeRefusals | false | List each run that could not be resolved, not only how many per file |
units-le.workspace.scanProblemsEnabled | false | Also show the runs that could not be resolved in the Problems panel |
units-le.safety.enabled | true | Warn before reading a large file |
units-le.safety.fileSizeWarnBytes | 1000000 | Size above which the warning appears |
units-le.statusBar.enabled | true | Show the status bar item |
units-le.telemetryEnabled | false | Local-only event log (see Privacy) |
Languages
Twelve languages besides English:
German · Spanish · French · Indonesian · Italian · Japanese · Korean · Portuguese (Brazil) · Russian · Ukrainian · Vietnamese · Chinese (Simplified)
Both halves are covered — the manifest (command titles, setting names and descriptions) and everything shown while the extension runs (notifications, the status bar and the report's headings). A refusal's sentence and a parser's error are the engine's English, identical to the CLI's.
Privacy & security
- No network access. The extension never sends data anywhere. The
telemetryEnabledsetting only writes events to a local Output Channel you can inspect (Units-LE). - It reads the active document and nothing else, and never writes to it.
- The MCP server holds the same line. It takes content as an argument and returns data: no filesystem access, no network calls, no telemetry.
- Error notifications redact home directories and credential-shaped fragments.
- One rating prompt, at most twice. On the 3rd successful use the extension asks once whether you would rate it, and once more on the 20th if you chose Later or dismissed it. Don't Ask Again ends it. Setting
notificationsLeveltoimportantorsilentyourself turns it off. The counts are kept in VS Code's extension storage and nothing is sent anywhere; Rate opens the listing you installed from — the VS Code Marketplace or Open VSX — in your browser.
Documentation
| What | Where |
|---|---|
| What the tool is allowed to say — the grammar, the refusals, the output contract, non-goals | crate/SPEC.md |
| How the extension is built and held together — architecture, invariants, toolchain, release | AGENTS.md |
| How the CLI is built and held together | crate/AGENTS.md |
| What changed | CHANGELOG.md · crate/CHANGELOG.md |
| The tool's page, and the other fifteen | letools.dev/tools/units-le |
Performance
| Input | Size | Found | Time | Rate | Scan speed |
|---|---|---|---|---|---|
| YAML config | 0.88 MB | 50,000 | 107.63 ms | 464,557/sec | 8.2 MB/s |
| TOML config | 0.73 MB | 30,000 | 49.08 ms | 611,287/sec | 14.9 MB/s |
| Log, scanned as text | 3.25 MB | 120,000 | 327.9 ms | 365,967/sec | 9.9 MB/s |
Median of 7 runs after warmup, on Apple M5 Pro, 24 GB RAM, Node 24.3.0. Inputs are generated
by scripts/benchmark.ts rather than checked in, so the sizes above are
exactly what was measured. Reproduce with bun run benchmark.
These are machine-specific and are not asserted in CI — a benchmark that gates a build only tells you how busy the runner was.
Testing
| Metric | Coverage |
|---|---|
| Statements | 87.26% |
| Branches | 79.16% |
| Functions | 96.06% |
| Lines | 89.17% |
623 test cases across 16 files, plus an integration suite that runs
in a real VS Code extension host and an end-to-end test that installs the
built .vsix into a clean profile.
Generated from a real run — coverage/coverage-summary.json and
coverage/test-results.json — by scripts/coverage-readme.js; CI fails if
this section drifts. Reproduce with bun run test:coverage, and the case
count is the one vitest prints.
More from the LE family
Sixteen single-purpose tools for the work in front of every model. Each ships a Rust CLI and an MCP server. One page: letools.dev
Get it out
- String-LE — Extract every string in a codebase, with its position, so a person can read them
- Numbers-LE — Extract every hardcoded number in a codebase, so a person can check them
- Units-LE — Extract every quantity with its unit, normalized, and refuse the ambiguous ones by name
- Dates-LE — Extract every date and timestamp, and the exact instant each one resolves to
- IDs-LE — Extract every UUID, ULID, NanoID, ObjectId and Snowflake, and decode the time inside
- IPs-LE — Extract every IP address, CIDR block and MAC, normalized and classified by scope
- URLs-LE — Extract every URL in a codebase, with its protocol and exact position
- Paths-LE — Extract every file path in a codebase, and say whether it still points at anything
- Colors-LE — Extract every color in a codebase, and say which ones are not in your palette
Check it
- Regex-LE — Find every regex in a codebase, and report which can be driven into catastrophic backtracking
- Versions-LE — Find where one dependency is constrained differently across a repository's manifests
- i18n-LE — Identify the i18n library a project uses, then audit its catalogs by that library's rules
- Scrape-LE — Check whether a page is scrapeable before the scraper is written, and say when it cannot tell
Guard it
- Secrets-LE — Find hardcoded credentials in a codebase, and never print one into the report
- EnvSync-LE — Compare the dotenv files in a tree, and say which keys are missing from which
- Unicode-LE — Find the Unicode that hides meaning — bidi controls, invisibles, homoglyphs, mixed scripts
Each stands on its own: no shared crate, no published core. Where two of them agree, it is because the same answer was right twice.
Contact — nolindnaidoo.com · GitHub · LinkedIn
Also by nolindnaidoo
Rust — pixelcoords and pixelactions are one loop: pixelcoords answers where, pixelactions acts there. Their own tools, their own voice — not part of the LE family.
- pixelcoords — Freeze your screen, mark regions, get pixel-exact coordinates and crops pixelcoords.dev · crates.io · docs.rs
- pixelactions — Consume human-verified coordinates, perform the interaction, confirm it landed pixelactions.dev · crates.io · docs.rs
License
MIT © nolindnaidoo