Crispy Profiling
Deterministic React render profiling: renders, wasted renders and their causes per component.
Runs on your machine from its package; the steps are below.
What it does
- Reads
- Writes
- High impact
Not assessed yet.
What it costs
FreeOdel charges nothing per call. The publisher may charge for its own service.
Runs locally over stdio
This server isn't hosted — your MCP client launches it from a package registry. Use one of the commands below, or drop the config into your client (e.g. Claude Desktop).
Run
npx -y crispy-profiling
MCP client config
{
  "mcpServers": {
    "crispy-profiling": {
      "command": "npx",
      "args": [
        "-y",
        "crispy-profiling"
      ]
    }
  }
}Snapshot testing for React re-renders — deterministic, runtime-proven, with the fix.
crispy-profiling is a React re-render profiler (npm: crispy-profiling): CLI, GitHub Action, MCP server and Agent Skill. Not related to the crispy style-guide package or to the scientific software of the same name.
Your React app feels slow when you type or click? crispy shows which components re-render for no reason, and the exact line to fix.


Quick start
npm i -D crispy-profiling   # or: pnpm add -D crispy-profiling · yarn add -D crispy-profiling
npx crispy install   # downloads Chromium once (if that fails, an installed Chrome/Chromium is used)
npx crispy scan      # zero config: starts your dev server, finds interactions, profiles them
npx crispy test      # records crispy.snap.json from the scanned scenarios → commit it
Using pnpm or yarn? Run the same commands as pnpm exec crispy … or yarn crispy ….
New to this? Three things to know.
crispy scanonly looks at your app: it edits none of your code and sends nothing anywhere (requests that would change data are blocked).- It prints a short list of root causes. Each names a file and a line and says what to change.
"No avoidable renders" means the flows it tried are fine; its
Not triedlines say what it skipped, andcrispy.config.jsonis where you add the interaction that feels slow. - After a fix, run
npx crispy testagain: 🟢 means fewer renders (check that the screen still updates), 🔴 means a render came back. Nothing is saved over your snapshot unless you ask (-u).
Words you will see: a render is React running a component again; avoidable means its
inputs did not really change, so the screen would look the same without it; hoist means move a
constant out of the component; memoize means keep the same value or function between renders
(useMemo, useCallback, React.memo). A component re-renders whenever its parent does, even
with the same props, unless it is wrapped in React.memo; and React.memo only skips the render when
its props are stable, so crispy usually asks for both.
crispy scan detects Next.js/Vite, the dev URL (the port your dev server prints, e.g. server.port
in vite.config.ts) and your dev command, visits a few routes, tries
their safe interactions (buttons, including icon-only ones, tabs, selects, text inputs, internal links, rows
of a table or list with a pointer cursor — never anything named delete, pay, sign out, submit…, in several languages), and prints the top root causes with the fix.
Like every crispy command, it is read-only: requests other than GET and messages the page sends over a WebSocket never leave
the browser (hot-reload sockets excepted), and an interaction that tried to
send one is reported and not saved (--allow-writes for apps with disposable data). Point it at a
development or preview build, not production. It saves what it ran as
crispy.config.json, so crispy test guards those flows from then on. It adds .crispy/ (reports) to .gitignore; commit crispy.config.json and crispy.snap.json. On shadcn-admin it found
the first root causes in 2.5 minutes without a single line of config. Prefer writing the steps
yourself? npx crispy init creates a config to edit.
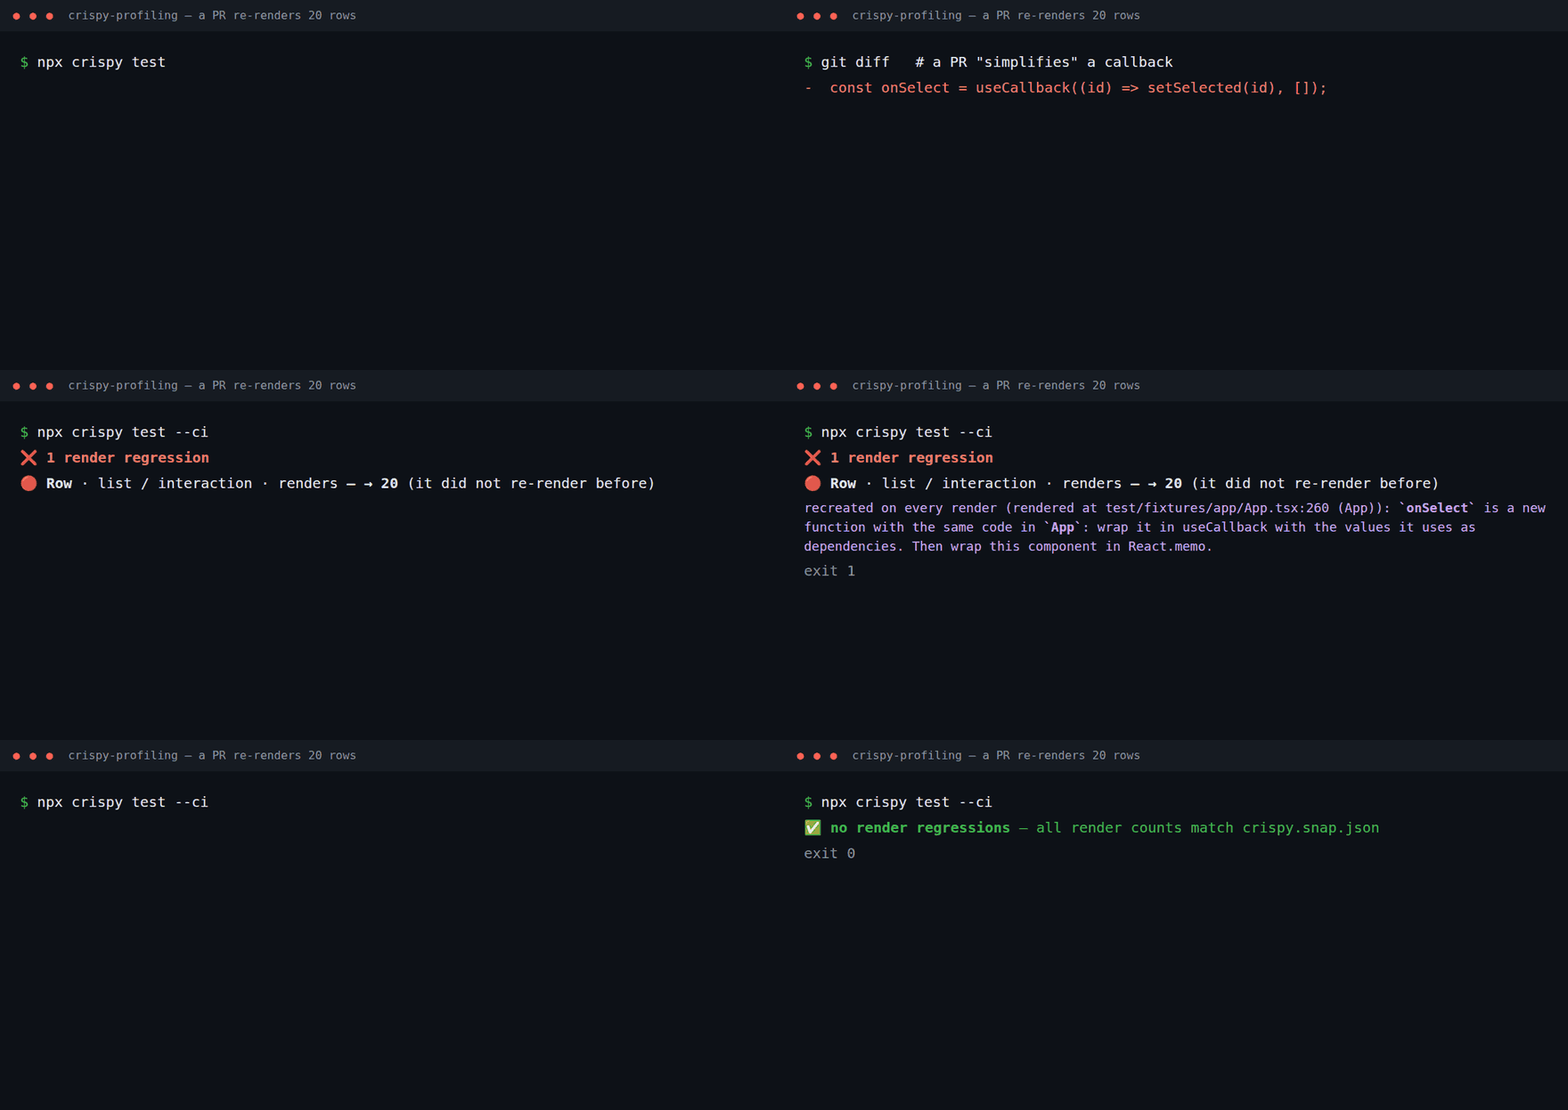
From then on, npx crispy test (locally, in CI or from an AI agent) fails when a component starts
re-rendering, and tells you why and how to fix it:
| 🔴 regressed | list / interaction | Row | renders | — → 20 | recreated on every render (rendered at
  src/App.tsx:222 (App)): `onSelect` is a new function with the same code in `App`: wrap it in
  useCallback with the values it uses as dependencies. Then wrap this component in React.memo. |
For a one-off look at a flow, npx crispy run prints every component with its causes and a fix:
| Component | Renders | Avoidable | Callback | Why it rendered         | Rendered at             | Why / how to fix |
| Row       |      20 |         0 |       20 | recreated callbacks 20  | `src/App.tsx:222 (App)` | `onSelect` is a new function with the same code in `App`: wrap it in useCallback… |
| Status    |       1 |         1 |        0 | recreated props 1       | `src/App.tsx:178 (App)` | `style` is recreated with equal data in `App`: hoist it out of the component or wrap it in useMemo… |
| App       |       1 |         0 |        0 | own state 1             | `src/main.tsx:12`       | state updates here cause 23 avoidable render(s) below (`Row`, `Header`, `Status`)… |
Every phase starts with Root causes — fix these first: the few components that recreate a
value, recreate a context value or update state that re-renders unchanged children, ranked by the
avoidable renders they cause, with the child where one React.memo would stop most of a cascade.
"Rendered at" and definedIn are mapped back to your original source files and lines through the
source maps your dev server or bundler serves (Vite, webpack, Turbopack); without source maps they
refer to the code the browser runs.
Works with Vite and Next.js (Turbopack and webpack dev servers); framework internals such as the Next.js dev overlay are filtered out. Profile the development build.
Status: early (0.x), improving every week. Validated on five open-source apps (Redux Essentials, Next.js App Router Playground, Excalidraw, shadcn-admin, react-admin): it found a fixable re-render problem in each. See Known limitations and the changelog. Bug reports, wrong hints and case studies are the most valuable contribution right now.
crispy-profiling opens your React app in headless Chromium, runs the interactions you describe, and tells you which components rendered, how many times, why (props / state / context / parent) and which renders were avoidable. Per-component render counts are reproducible, so two reports of the same scenario only differ when the code changed (commit counts and effect cascades can vary with load timing; snapshots store them as ranges). That makes it a reliable feedback loop for:
- AI coding agents: an MCP server and an Agent Skill so Claude Code, Cursor, Codex, Copilot & co. can measure a re-render fix instead of guessing.
- CI: render budgets and baseline comparison that fail a PR when a component starts re-rendering.
- You: a CLI that answers "why does this re-render?" without opening DevTools.
No code changes in your app: it uses the same hook React DevTools uses. Tested on React 19 and validated on 18.3 and 19.0 apps; React 16.8–17 expose the same hook but are not tested.
Render snapshots (crispy test)
Like Jest snapshots, but for re-renders. Commit the expected render counts of your key flows; every PR — written by a person or an AI agent — is checked against them at runtime.
npx crispy test        # 1st run: writes crispy.snap.json → commit it
npx crispy test        # later: fails if any component renders more (or more avoidably)
npx crispy test -u     # accept intended changes / lock in improvements
npx crispy test --ci   # in CI: a missing snapshot fails instead of being written (auto-detected; --no-ci to opt out)
When something regresses you get the component, the cause, where it is rendered and the fix (see Quick start).
crispy.snap.json has one line per component, so the PR diff shows exactly which counts changed:
"interaction": {
  "commits": 1,
  "components": {
    "App": { "renders": 1, "avoidable": 0 },
    "Header": { "renders": 1, "avoidable": 1 }
  }
}
Rules: any increase in renders or avoidable renders fails (snapshot.tolerance allows slack), and
every metric is checked independently, so an improvement never hides a regression. More commits are
reported as ℹ️ but do not fail, because they vary with load timing (snapshot.failOnMoreCommits to fail).
Counts that varied between runs are stored as [min, max] ranges and only fail outside them
(-u keeps the known range instead of narrowing it). Decreases pass and suggest -u. New UI
passes and is reported (record it with -u); if it already renders avoidably it is flagged ⚠️
(set snapshot.failOnNewAvoidable to fail instead). When the number of renders stays the same but more of them become avoidable — typical right after a fix uncovers the next cause — the row shows 🟡 now avoidable with the fix and does not fail (snapshot.failOnMoreAvoidable to fail). A known component that starts re-rendering
in a phase still fails. A rename, even combined with a move to another file, with the same counts
is reported as 🔁 renamed, not as a regression.
crispy test never edits the committed file on its own; the
snapshot always covers every component (even with topComponents); budgets still apply.
In your Playwright tests
Already have Playwright e2e tests? Guard re-renders inside them, no separate scenarios:
import { test } from '@playwright/test';
import { renders } from 'crispy-profiling/playwright';

test('search does not re-render the product list', async ({ page }) => {
  const r = await renders(page);        // before page.goto
  await page.goto('/');
  await r.phase('search');
  await page.fill('#search', 'shoes');
  await r.toMatchSnapshot('search');    // __renders__/search.snap.json; fails with cause + fix
});
The first run writes the snapshot (commit it); CRISPY_UPDATE=1 accepts intended changes; on CI
(CI set) a missing snapshot fails. r.report() returns the full report for custom assertions.
Configuration
crispy.config.json (JSON Schema):
{
  "$schema": "./node_modules/crispy-profiling/schema/crispy.config.schema.json",
  "baseUrl": "http://localhost:5173",
  "runs": 3,
  "scenarios": [
    {
      "name": "search",
      "path": "/products",
      "steps": [
        { "action": "type", "selector": "#search", "value": "shoes" },
        { "action": "phase", "name": "sort" },
        { "action": "click", "selector": "text=Price: low to high" }
      ],
      "budgets": {
        "interaction": { "maxAvoidableRenders": 0, "components": { "ProductCard": { "maxRenders": 20 } } }
      }
    }
  ]
}
| Field | Default | Description |
|---|---|---|
baseUrl | — | Origin of the running app. |
runs | 3 | Runs per scenario; the report keeps median/min/max and flags unstable counts. |
settleMs | 300 | A step is "settled" after this long without React commits and without in-flight network requests. |
maxSettleMs | 10000 | Max wait per step. Pages that never settle (polling, animations) produce a warning in the report instead of hanging. |
cpuThrottle | 1 | Slow the CPU down (e.g. 4) to check counts on a slow CI runner or low-end device. Counts should not change. |
clock | false | Control timers with a fake clock (setTimeout, setInterval, requestAnimationFrame, Date, performance) so polling/animated apps give deterministic counts. |
timeoutMs | 30000 | Max time for navigation, a step or settling. |
readOnly | true | Block every request other than GET, and WebSocket messages the page sends (only the dev server's own hot-reload sockets are excepted), while profiling, so replayed clicks never change data. A WebSocket connection itself is still opened and can receive: only what the page sends is dropped. Blocked writes are listed in the report's warnings. Set false only for flows that must write, e.g. against a disposable test database. |
timings | false | Add main-thread CPU per phase (cost: ms of JavaScript and of all main-thread work, also in production builds), component self time and LCP/CLS/long tasks. Off by default: timings are not reproducible. |
topComponents | 0 | Keep only the N most-rendered components per phase (0 = all). |
viewport | 1280×800 | Browser viewport. |
browser | headless | executablePath, channel (e.g. "chrome"), headless. CRISPY_CHROMIUM_PATH also works. |
includeInternals | false | Show framework/library internals (components defined in node_modules that only library code renders, e.g. Next.js router internals). Library components your code renders directly are always shown. |
webServer | — | { "command": "npm run dev" }: crispy starts your dev server, waits for baseUrl (or url) and stops it afterwards, also on Ctrl-C. A server already running there is reused locally (with a warning) but not on CI, where it fails instead (reuseExisting to override). If baseUrl never answers but the server announces another local URL, crispy uses it and tells you. crispy init fills it in. |
login | — | { "path": "/login", "steps": [...] }: sign in once before profiling (never counted). Use "${E2E_PASSWORD}" to read secrets from the environment ("$${NAME}" types a literal ${NAME}). |
storageState | — | A saved session file (cookies + localStorage), e.g. from crispy login for SSO/OAuth logins. Keep it out of git. |
random | seeded | Math.random returns the same sequence in every run, so fake data, IDs and animations render the same way. native keeps the browser's. |
snapshot | crispy.snap.json, 0, false, false, false, false | file (relative to the config file), tolerance, failOnNewAvoidable, failOnMoreAvoidable, failOnMoreCommits and includeLibraries (also record components defined in node_modules, such as icons; off because their counts follow the app component that renders them) used by crispy test. |
compare | 10%, 1 | rendersIncreasePct and minRendersDelta used by compare. |
Steps: click, hover, fill, type, press, select (a <select> option), drag
(selector to to, or by dx/dy, with pointer steps), scroll, waitFor (state:
visible, hidden, attached, detached), wait, goto, phase, and expect (selector with
text or count): it fails the scenario when the screen does not show what it should, so a fix that
freezes the UI fails crispy test instead of passing with fewer renders. Add one after each
interaction whose result matters, e.g. { "action": "expect", "selector": "#cart-count", "text": "3" }.
text and visibility are checked on the visible matches, so a hidden duplicate (a mobile menu, a
screen-reader label) does not fail the step; count counts every match ("selector >> visible=true"
to count only visible ones). A scenario whose step fails is skipped and named in the output: the
other scenarios still produce their report or snapshot comparison.
type presses one key at a time and waits for React to finish (including deferred values and
transitions) before the next key, so concurrent features give the same counts on fast and slow CPUs.
Renders before the first step are recorded in phase load; renders during steps go to
interaction unless you name phases yourself with { "action": "phase", "name": "..." }.
Budgets (per phase): maxCommits, maxTotalRenders, maxAvoidableRenders, maxWastedRenders,
and per component maxRenders / maxAvoidableRenders / maxWastedRenders.
A budget for a phase the scenario never produces is a config error; a component budget that never
matches a rendered component produces a warning (likely a typo). Budgets always see every component,
even when topComponents trims the report.
What the numbers mean
| Field | Meaning |
|---|---|
renders | Times the component function/class rendered (mounts + updates). |
avoidableRenders | Updates where nothing really changed: wasted renders plus renders caused only by recreated-but-equal data (objects, arrays, elements, dates, maps…). Certainly avoidable. |
callbackRenders | Updates caused only by functions recreated with the same code (inline callbacks). Avoidable if the values they capture did not change — crispy cannot see captures, so they are reported apart. |
wastedRenders | Updates where props (shallow), state and consumed context were all unchanged. |
causes.props / state / context | Updates where that input changed (one update can have several causes). |
causes.unstable | Only data identities changed: object/array literals, dates, maps, context values or hook results recreated with equal contents. |
causes.callback | Only functions were recreated with the same code (bound/native functions count as real changes). |
causes.parent | Updates with no changed input: the parent re-rendered (same as wasted). |
unstableProps | Prop keys recreated with equal data — fix with useMemo or by hoisting constants. |
callbackProps | Prop keys that were recreated callbacks — fix with useCallback and the right dependencies, or React Compiler. |
changedProps | Prop keys whose identity changed, with counts — the "why" behind causes.props. |
triggeredBy | Components whose own state update started the cascade that re-rendered this one, with counts. Fix the trigger, not every child. |
recreatedContextFrom | Components that own a context provider whose value was recreated with equal content (e.g. value={{ user, logout }}) — memoize the value there. |
memo | true when the component is wrapped in React.memo, so hints never suggest wrapping it again. |
memoSkips / uselessMemo | Renders that React.memo skipped in the scenario (all phases). A memo component that updated at least 3 times and never skipped one is flagged uselessMemo, with a hint to consider removing it — a guardrail against memoizing everything. |
stateChanges | Which state changed when the component's own state caused the render: `query` (useState) when the hook is written in the component, or store subscription (useSyncExternalStore) in useAppSelector`` for store and router hooks (Redux, Zustand, routers); when several custom hooks could hold it, it says "in one of …". React DevTools only shows hook numbers. |
effectCascades | State that a useEffect in this component sets right after a render: its own (`d` (useState)), a parent's through a setter prop (… in `Parent` (via a prop)) or a store (a store read by `Reader`). Each one is an extra commit (cascadeCommits, with cascadeRenders renders); the hint says how to remove it (compute during render, set it in the event handler, or call the parent's setter there). Not counted: layout effects (measuring the DOM), transitions, deferred values, effects that ran because the component mounted. Needs createRoot on React 18+. |
creators | `prop |
staleMemo | `prop |
providerAt | Where the provider of a recreated context value is rendered. |
compiled | true when React Compiler compiled the component. |
locations | Up to 3 places where the component is rendered, as file:line (Owner) (owner JSX call site, most frequent first), resolved through source maps when available. |
Item (src/List.tsx) keys | Components are identified by name and the file that defines them (resolved through the DevTools protocol). Distinct components that share a name are keyed as Name (file), so adding an unrelated Item never renames existing ones; snapshots store the file and keep matching. When files cannot tell them apart (styled-components, HOC factories, several components in one file), they are keyed by where they render (Item @ src/Card.tsx:12); numbered keys (Item#2) are the last resort. Keys stay the same across goto navigations. |
definedIn | File where the component function is defined. |
stable | false when counts differ between runs (timers, network, randomness). |
Every Markdown report (crispy run, crispy test, MCP tools) adds a Why / how to fix column
built from these fields. Hints point at the root cause: the component whose state starts a cascade,
the owner that recreates a prop (with its file:line), or the provider that recreates a context value.
Profile the development build: production builds minify component names.
CLI
crispy scan [url] [--routes 3] [--actions 5] [--allow-writes]  Zero config: find, profile and save interactions
crispy init [--base-url <url>]          Create crispy.config.json (detects framework, URL, dev command)
crispy install [--with-deps] [--verbose]  Download the Chromium build crispy uses (--verbose: full download log)
crispy login [-c file] [--path /login]  Sign in by hand in a browser window and save the session
crispy run [-c file] [-o file] [-s scenario...] [--markdown file] [--no-fail]
crispy test [-c file] [-u|--update] [--ci] [-s scenario...] [--markdown file]
crispy compare <base.json> <head.json> [--threshold 10] [--min-delta 1] [--markdown file] [--json file] [--no-fail]
crispy mcp                              Start the MCP server on stdio
Exit codes: 0 ok · 1 budget violation, regression or failed expect step · 2 usage/runtime error.
For AI agents
MCP server
Tools: scan_app (no config yet: finds interactions and returns the top causes), profile_url,
run_scenarios, test_render_snapshots, compare_reports, inspect_component.
{
  "mcpServers": {
    "crispy-profiling": { "command": "npx", "args": ["-y", "crispy-profiling@latest", "mcp"] }
  }
}
Claude Code: claude mcp add crispy-profiling -- npx -y crispy-profiling@latest mcp
Claude Code plugin (MCP server + skill)
/plugin marketplace add edgeorgie/crispy-profiling
/plugin install crispy-profiling@crispy-profiling
Agent Skill (Claude Code, Cursor, Codex, Copilot, Gemini CLI, …)
npx skills add edgeorgie/crispy-profiling
The skill teaches the agent the measure → fix → re-measure → compare loop and how to map each signal
to a fix (React.memo, useCallback, useMemo, context splitting, state colocation).
CI (GitHub Action)
Save as .github/workflows/crispy.yml:
name: crispy
on: pull_request
permissions:
  contents: read
  pull-requests: write   # lets crispy comment on the PR
jobs:
  renders:
    runs-on: ubuntu-latest
    steps:
      - uses: actions/checkout@v7
      - uses: actions/setup-node@v7
        with: { node-version: 22 }
      - run: npm ci
      - uses: edgeorgie/crispy-profiling@v0   # starts your dev server (webServer) and runs `crispy test --ci`
The action installs Chromium and its system libraries itself: no browser setup in the workflow.
Before the first run, record and commit the baseline: npx crispy test locally, then commit
crispy.snap.json. Without it the job fails with "missing snapshot" (by design: CI never records one
for you). @v0 is a moving tag for the 0.x releases; pin @v0.2.0 (or a commit SHA) to freeze it. On
pull requests from forks GitHub gives the token no write access, so the PR comment is skipped with a warning; the job
summary and the pass/fail result still work.
If the job is red: open the job summary, fix the cause it names, push again. If the change is intended,
a person runs npx crispy test -u and commits the new snapshot.
Each scenario runs 3 times (runs), so a config with many scenarios can take minutes. Split it across
runners with a matrix and the scenarios input (names separated by spaces or commas); each job checks
only its share of the committed snapshot:
    strategy:
      matrix:
        scenarios: ['tasks users', 'settings sidebar-toggle']
    steps:
      # checkout, setup-node, npm ci as above
      - uses: edgeorgie/crispy-profiling@v0
        with: { scenarios: '${{ matrix.scenarios }}' }
Locally the same split is npx crispy test -s tasks -s users. Budget: about 20–25 s per scenario
per run on a GitHub runner, plus one minute to install Chromium.
The step fails when any component renders more than the committed snapshot allows (or a budget is
exceeded). The job summary — and one PR comment, updated on every push — lists each regression with
its cause, where it is rendered and the suggested fix (comment: false to disable). command: run (with an optional baseline report) is available for budget-only or
baseline-comparison setups. Full workflow: examples/github-workflow.yml.
Programmatic API
import { compareReports, parseConfig, profile } from 'crispy-profiling';

const config = parseConfig({ baseUrl: 'http://localhost:5173', scenarios: [{ name: 'home' }] });
const report = await profile(config);
How it compares
Use the tools together: they answer different questions.
| Tool | What it is for | Where crispy fits |
|---|---|---|
| React DevTools Profiler | Interactive, manual profiling in your browser | crispy runs the same kind of analysis headless, on scripted interactions, every time |
| React Scan | Visual highlighting of re-renders while you use the app; also has a programmatic onRender API | crispy turns render counts into committed snapshots that fail CI, with a fix hint per component |
| why-did-you-render | Console notifications in development about avoidable re-renders (Babel setup) | crispy needs no app changes and reports per interaction, deterministically |
| React Doctor | Static analysis (lint rules) of the codebase with a score | crispy observes what actually rendered at runtime; static findings and runtime proof complement each other |
| React Compiler | Automatic memoization at build time | crispy shows what the compiler did not cover (e.g. dependencies that change every render) and verifies the result |
What crispy adds: deterministic counts (same code → same report), snapshots in CI, root-cause hints (who creates the unstable value, which dependency changes) and verification (the fix shows up as 🟢 improved).
Known limitations
- 🟢 means fewer renders, not a working UI. A React.memo on a component that reads mutable data (a table or form instance) removes renders and updates. After a fix, check that the affected screens still change when they should.
- Development builds only. Production builds strip component names and the debug information crispy uses for causes and locations.
- Render counts are not milliseconds. crispy finds avoidable renders deterministically; whether
they matter depends on how expensive the components are. Use
timings: true(not reproducible) to see the CPU each phase costs in ms, plus self time, LCP and long tasks. - Measuring has a cost. The render hook adds main-thread work (about 25 % more JavaScript time on shadcn-admin): compare ms between crispy runs, not against an uninstrumented browser.
- Web only, Chromium only. No React Native; other browsers are not needed for render counts.
- Scenarios are written by hand or generated by
crispy scan(safe interactions only). - Hints are heuristics. In our validation on real apps most hints pointed at the right component, but not all were directly actionable; report a wrong hint with the report attached and we will fix it.
- Apps with real network timing can vary between runs: counts are stored as ranges, randomness
is seeded and one extra commit is tolerated, but very timing-dependent flows may need
waitForsteps orclock: true.
How this is built
crispy-profiling is developed with AI coding agents (Claude Code) under human direction, with the same rules as any contribution: atomic commits, tests, CI on Node 20/22/24 and review. Every milestone is checked by an independent agent acting as a hostile reviewer and validated on real open-source apps; every number in this README and in the changelog can be reproduced with the commands shown. Found something wrong? Please open an issue.
How it works
An init script installs (or wraps) __REACT_DEVTOOLS_GLOBAL_HOOK__ before React loads. On every
commit it walks the new fiber tree against its alternate, like React DevTools, and records each
component that performed work, comparing props, hook state and context values to classify the cause.
See docs/ARCHITECTURE.md.
Contributing
Tried it on your app? Five lines are enough: the app and versions, the command, what crispy printed,
what you expected, what you changed and what happened to the counts. Open an
"I tried it on my app"
issue; wrong hints have their own form.
PRs are welcome too — see CONTRIBUTING.md (GitFlow: branch from develop). AI coding agents: start with AGENTS.md; docs index for LLMs:
llms.txt.
License
MIT © Edwin Jorge